How many people are in this city?
Most people answer that question citing a census source. And that's usually a good place to start: census measures where people sleep (i.e., 'residents') and if people are sleeping in a city, it's probably a decent approximation of the demographic size of that city.
But cities also come alive during the day. Commuters pour into business districts, students fill university towns, tourists concentrate around a handful of attractions, and entire neighborhoods empty out as residents leave for work. The population a city holds at 2pm on a Tuesday can look nothing like the population it holds at 2am.
Researchers have confirmed this before. A 2020 study published in Nature Communications, built on European Commission Joint Research Centre data, modeled hourly population shifts across the EU and found that in the centers of Europe's 34 largest cities — each with more than a million residents — daytime population ran, on average, nearly twice as high as nighttime population. That's a useful confirmation the pattern is real and significant. It's also over a decade out of date: the underlying population data is from 2011, modeled at 1-kilometer resolution.
These nuances are critically important for businesses looking to invest in a new retail location. Where foot-traffic is a golden indicator, every astute site selection team will be looking for ways to predict the potential traffic value of each site. Census will struggle with this for the reasons noted above: where people sleep often has little correlation with where they spend their working hours, shopping and recreation time. And so for franchisors and other retailers looking to capitalize on daytime economic activity, they will need something more than census data.
Enter LandScan: a population dataset built by Oak Ridge National Laboratory (U.S. Department of Energy's national lab) that models ambient population, meaning where people actually spend their time across an average day, not just where they're registered as living. It blends satellite imagery, road networks, land use, and other real-world signals into a single population estimate for any point on the map. It's the same category of data emergency planners and humanitarian responders use to estimate exposure and demand in a crisis, repurposed here for a considerably lower-stakes question: where to put your next store.
We compared residential/census population measurements with daytime/LandScan measurements in every major European city with 1 million or more registered residents. The resulting ratio, what we call Daytime Differential, ranges from 0.45 to 1.90 across the 43 cities in the dataset: some host barely half their daytime population relative to who actually lives there, while others nearly double. Here's the full breakdown, city by city.
The data: size vs. daytime pull, in one picture
Methodology: every city with a published residential population of 1 million or more, anchored to its official Google Places centroid, with a 15-minute drive-time isochrone drawn around that point. WorldPop 2026 gives the residential population inside that isochrone; LandScan 2024 gives the ambient (daytime) population inside the same boundary. Both figures share the identical footprint for each city, which is what makes comparing them meaningful.
Daytime Differential = LandScan (ambient) ÷ WorldPop (residential).
Above 1.3 is generally daytime-dominant (meaning a significant influx of non-resident traffic) 0.8–1.3 is balanced, below 0.8 is residential-dominant (meaning a significant number of people leave these areas during the day). Here it's applied at the city level instead of a single address, so the read is comparative; which cities pull in more daytime traffic than their residential base alone would predict, and which quiet down.
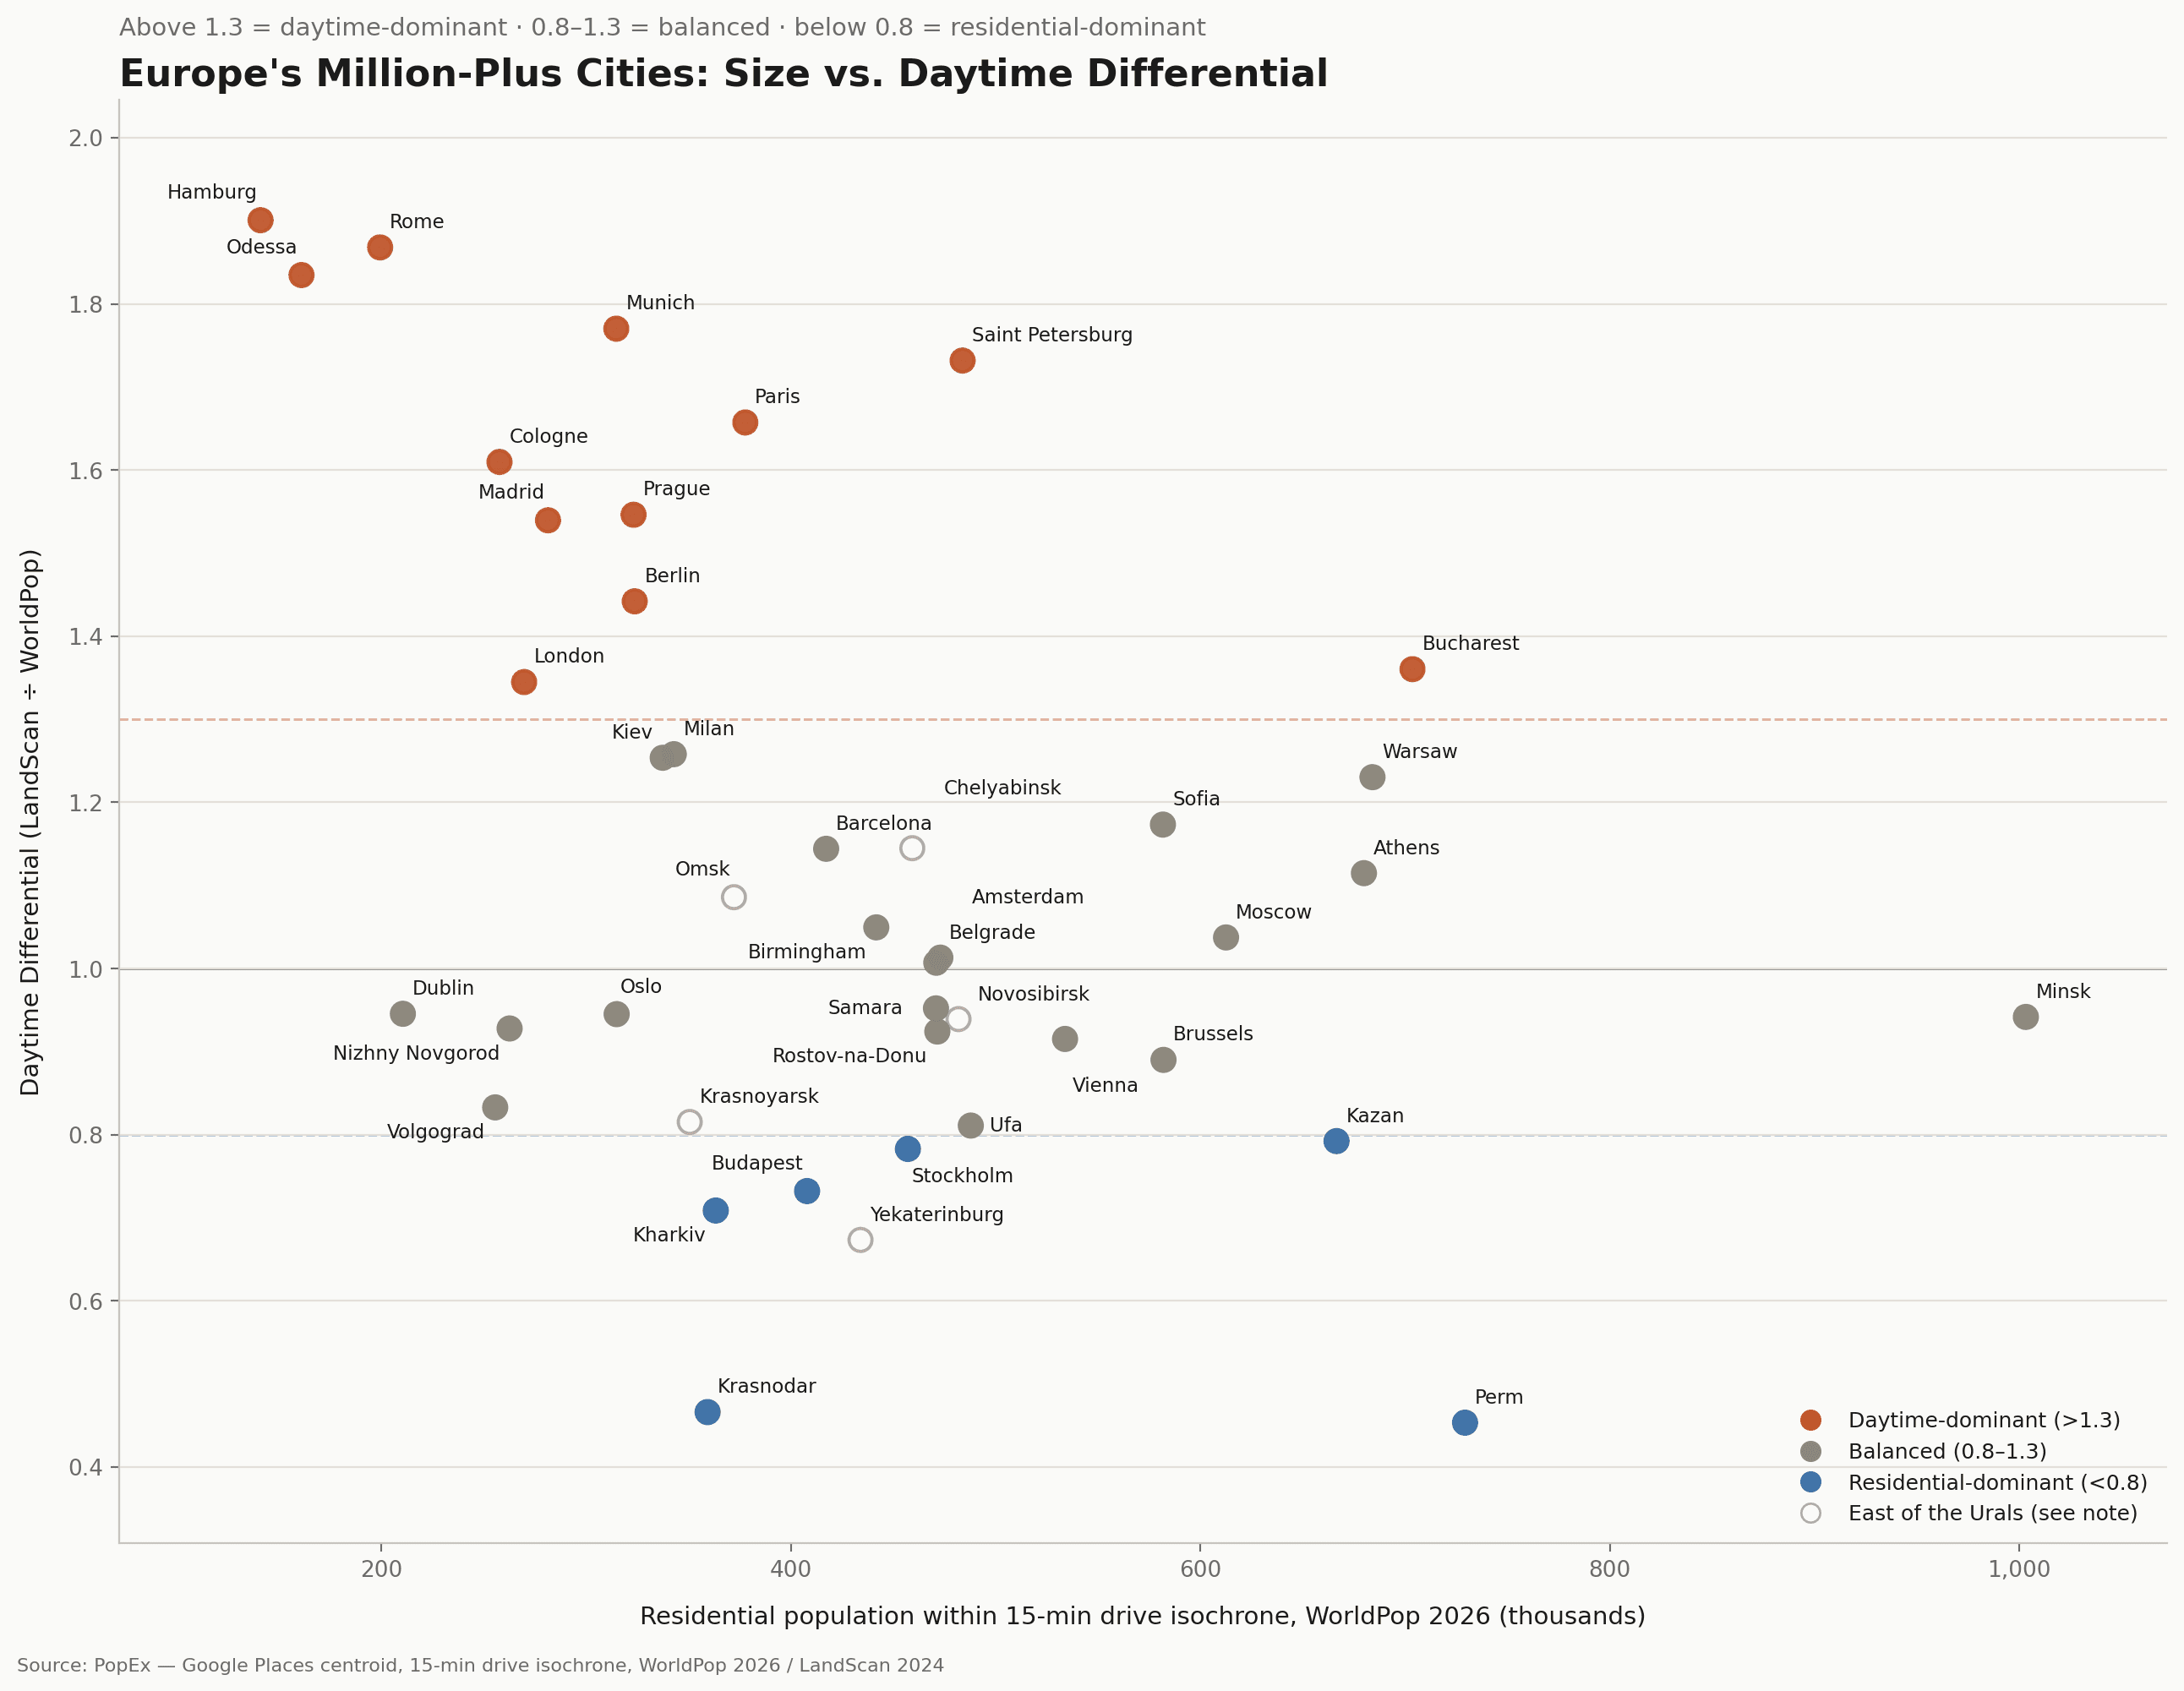
Plotting both dimensions at once separates four kinds of cities. Saint Petersburg and Bucharest are the standouts in the upper-right: large residential bases (both approaching or above 700K–840K within the isochrone) that still land solidly in daytime-dominant territory. This is the combination that matters most for retail site selection or mapping competitive franchise territories. Hamburg, Rome, and Odessa post the highest ratios in the dataset, at or near 1.9; comparatively modest residential bases that nearly double in the daytime count. This ratio would also point towards strong, prospective customer activity. Minsk is the counterexample worth naming. It contains the second-largest residential base of any city here, and squarely balanced at 0.94. Which leads to an interesting caveat that residential size alone doesn't predict daytime pull. And Perm and Krasnodar, both meaningfully sized cities, land furthest into residential-dominant territory, at 0.45 and 0.47. A relatively strong indication that residents leave these areas during the day.
Full ranking
City | Country | Residential (WorldPop 2026) | Ambient (LandScan 2024) | Daytime Differential |
|---|---|---|---|---|
Hamburg | Germany | 140,986 | 267,960 | 1.90 |
Rome | Italy | 199,374 | 372,412 | 1.87 |
Odessa | Ukraine | 160,973 | 295,326 | 1.83 |
Munich | Germany | 314,752 | 557,129 | 1.77 |
Saint Petersburg | Russia | 483,889 | 837,940 | 1.73 |
Paris | France | 377,739 | 625,991 | 1.66 |
Cologne | Germany | 257,685 | 414,772 | 1.61 |
Prague | Czechia | 323,187 | 499,668 | 1.55 |
Madrid | Spain | 281,386 | 433,178 | 1.54 |
Berlin | Germany | 323,735 | 466,800 | 1.44 |
Bucharest | Romania | 703,659 | 957,155 | 1.36 |
London | United Kingdom | 269,720 | 362,694 | 1.34 |
Milan | Italy | 342,804 | 431,210 | 1.26 |
Kiev | Ukraine | 337,411 | 422,969 | 1.25 |
Warsaw | Poland | 684,103 | 841,601 | 1.23 |
Sofia | Bulgaria | 581,746 | 682,476 | 1.17 |
Chelyabinsk* | Russia | 459,328 | 525,809 | 1.14 |
Barcelona | Spain | 417,245 | 477,328 | 1.14 |
Athens | Greece | 679,920 | 757,899 | 1.11 |
Omsk* | Russia | 372,211 | 404,131 | 1.09 |
Birmingham | United Kingdom | 441,730 | 463,567 | 1.05 |
Moscow | Russia | 612,574 | 635,423 | 1.04 |
Amsterdam | Netherlands | 473,018 | 479,169 | 1.01 |
Belgrade | Serbia | 471,028 | 474,268 | 1.01 |
Samara | Russia | 470,888 | 448,258 | 0.95 |
Dublin | Ireland | 210,493 | 198,998 | 0.95 |
Oslo | Norway | 314,916 | 297,595 | 0.94 |
Minsk | Belarus | 1,003,255 | 944,699 | 0.94 |
Novosibirsk* | Russia | 481,894 | 452,515 | 0.94 |
Nizhny Novgorod | Russia | 262,622 | 243,644 | 0.93 |
Rostov-na-Donu | Russia | 471,542 | 435,744 | 0.92 |
Vienna | Austria | 533,935 | 488,616 | 0.92 |
Brussels | Belgium | 582,023 | 517,952 | 0.89 |
Volgograd | Russia | 255,581 | 212,837 | 0.83 |
Krasnoyarsk* | Russia | 350,615 | 285,827 | 0.82 |
Ufa | Russia | 487,907 | 395,633 | 0.81 |
Kazan | Russia | 666,543 | 528,027 | 0.79 |
Stockholm | Sweden | 457,176 | 357,839 | 0.78 |
Budapest | Hungary | 407,928 | 298,615 | 0.73 |
Kharkiv | Ukraine | 363,310 | 257,445 | 0.71 |
Yekaterinburg* | Russia | 434,035 | 292,206 | 0.67 |
Krasnodar | Russia | 359,348 | 167,447 | 0.47 |
Perm | Russia | 729,323 | 330,557 | 0.45 |
Novosibirsk, Omsk, Krasnoyarsk, Yekaterinburg, and Chelyabinsk sit east of the Ural Mountains — geographically Asia by the conventional physical dividing line. Included here because Russia is classified under Eastern Europe in the UN geoscheme and most standard statistical conventions, consistent with how this city list was built at the country level.
A minor note on dates: residential figures are WorldPop's 2026 estimate; ambient figures are LandScan's latest available (2024) release, a two-year gap rather than the same calendar year. For most cities here that's immaterial. For Kiev, Kharkiv, and Odessa specifically, where conditions have kept shifting quickly, treat the exact figures as a snapshot rather than a precise same-moment comparison.
Impact on retail planning
A city's daytime population is the population that actually shows up to buy something. If you're evaluating a retail site anywhere or setting a new franchise territory map in one of these markets, the residential population figure most tools show you is, at best, a loose approximation of demand. And in dense urban cores, that approximation is often a real underestimate of who's actually on the street during business hours. The chart above shows that gap at the city level, using the same Daytime Differential and the same bands you'll use to size a single address: check it before you evaluate a specific site.
Every number above is a metro-wide average, whereas your actual candidate will be much smaller: one address, with its own isochrone and its own ratio, which can look very different from the city it sits in.
Run your own analytics
PopEx provides free access to Landscan, WorldPop and a number of other datasets through its Starter account. Access the map for free today, search your locations and analyze your own daytime differential.