Introduction
Most population rankings are residential. They count where people live: where they sleep, where their households are registered, where the census finds them on enumeration day. That measure is useful for housing and school planning. It is less useful for understanding where economic activity is concentrating, where retail demand is growing, or where franchise and commercial expansion is worth pursuing.
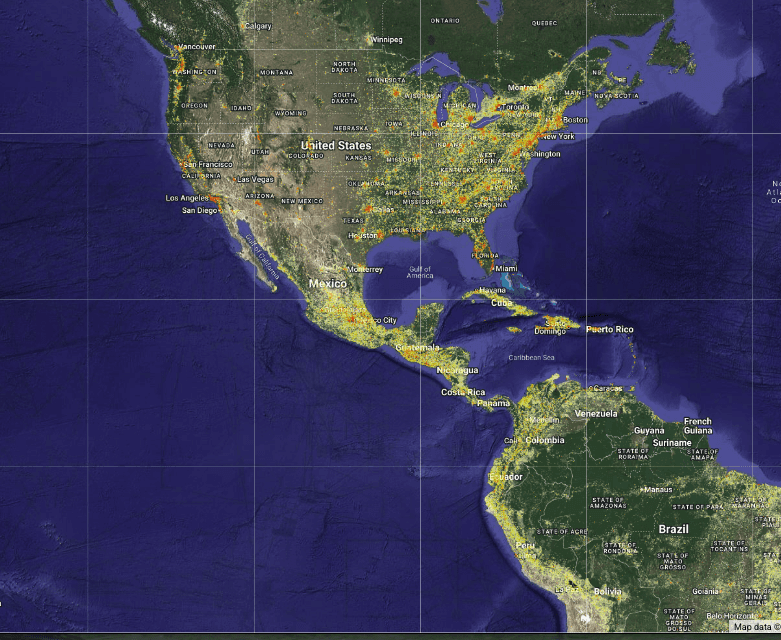
Ambient population takes a different approach. Rather than measuring residential location, it models the average distribution of human activity across a geography throughout the day - incorporating employment centres, transportation corridors, retail districts, universities, healthcare facilities, logistics zones, and the movement of people between them. A commuter-heavy downtown may have relatively few residents but enormous daytime activity. A residential suburb may house large populations but generate relatively little daytime economic concentration. Ambient population captures both.
This report analyses LandScan ambient population data across 33,791 U.S. ZIP codes from 2016 to 2024 - eight years that included remote work adoption, post-pandemic urban shifts, and continued Sunbelt expansion. The rankings are presented in three categories: highest ambient population in 2024, strongest growth from 2016 to 2024, and sharpest declines over the same period. A minimum 2016 ambient population floor of 10,000 is applied to the growth and decline rankings to remove statistical noise from very small geographies.
Between 2016 and 2024, total U.S. ambient population across all ZIP codes grew from approximately 326.5 million to 344.8 million, a national increase of 5.6%. Behind that aggregate, however, lies dramatic divergence at the ZIP code level.
Top 10 U.S. ZIP Codes by Ambient Population in 2024
Unsurprisingly, the ZIP codes with the highest total ambient population in 2024 are concentrated in dense urban cores and rapidly expanding suburban corridors. Several of the largest ambient population ZIP codes in 2016 have declined significantly by 2024, reflecting the effects of remote work and urban dispersal on traditionally high-density commercial zones.
Rank | ZIP Code | Location | 2016 Ambient Pop. | 2024 Ambient Pop. | 8-Year Change |
1 | 77494 | Katy, TX | 90,644 | 162,130 | +78.9% |
2 | 08701 | Lakewood, NJ | 101,912 | 144,897 | +42.2% |
3 | 10001 | Midtown Manhattan, NY | 186,373 | 143,550 | −23.0% |
4 | 11201 | Downtown Brooklyn, NY | 215,552 | 141,253 | −34.5% |
5 | 85281 | Tempe, AZ | 116,913 | 129,532 | +10.8% |
6 | 78666 | San Marcos, TX | 96,307 | 122,873 | +27.6% |
7 | 77479 | Sugar Land, TX | 90,198 | 117,788 | +30.6% |
8 | 11368 | Corona, Queens, NY | 104,542 | 116,422 | +11.4% |
9 | 11220 | Sunset Park, Brooklyn, NY | 98,415 | 113,214 | +15.0% |
10 | 78130 | New Braunfels, TX | 79,046 | 112,744 | +42.6% |
The most striking story in this table is displacement at the top. ZIP codes 10001 (Midtown Manhattan) and 11201 (Downtown Brooklyn) were among the highest ambient population geographies in the United States in 2016. By 2024, both had declined sharply - Midtown by 23%, Downtown Brooklyn by 34.5% - reflecting the structural shift toward remote and hybrid work that hollowed out daytime commercial activity in traditional office cores.
Taking the top position by 2024 is 77494 in Katy, Texas, a fast-growing suburban community in the Houston metro, with ambient population nearly doubling over eight years. Texas ZIP codes account for five of the ten highest ambient population geographies in 2024, reflecting the sustained concentration of economic activity across the state’s major metros and their suburban corridors.
Top 10 Fastest-Growing U.S. ZIP Codes by Ambient Population (2016–2024)
The strongest growth ZIP codes are concentrated in a narrow band of Sunbelt suburbs: North Texas exurban towns, outer-ring Phoenix and Houston suburbs, a pocket of Central Florida, and one outlier in Hawaii. All reflect the same underlying dynamic - rapid residential expansion generating new commercial, retail, and service activity concentration.
A minimum 2016 ambient population of 10,000 is applied to exclude ZIP codes with very small base populations where even modest absolute growth produces extreme percentage figures.
Rank | ZIP Code | Location | 2016 Ambient Pop. | 2024 Ambient Pop. | 8-Year Growth |
1 | 75078 | Prosper, TX | 14,596 | 44,735 | +206.5% |
2 | 85396 | Buckeye, AZ | 10,932 | 28,934 | +164.7% |
3 | 75036 | Frisco, TX | 12,347 | 31,642 | +156.3% |
4 | 76177 | Fort Worth (Alliance), TX | 15,205 | 37,944 | +149.5% |
5 | 34771 | St. Cloud, FL | 11,910 | 29,424 | +147.1% |
6 | 77316 | Montgomery, TX | 14,674 | 35,667 | +143.1% |
7 | 96706 | Ewa Beach, HI | 24,341 | 59,155 | +143.0% |
8 | 75126 | Forney, TX | 36,615 | 86,222 | +135.5% |
9 | 76227 | Aubrey, TX | 18,805 | 43,188 | +129.7% |
10 | 77407 | Richmond, TX | 28,731 | 65,338 | +127.4% |
North Texas dominates the growth rankings. Six of the ten fastest-growing ambient population ZIP codes are located in the Dallas-Fort Worth and Houston metro areas; exurban communities such as Prosper, Frisco, Forney, Aubrey, Montgomery, and Richmond. These are not established suburbs but fast-converting agricultural and semi-rural landscapes being absorbed by major metro expansion. Prosper, Texas (75078) recorded the highest growth rate in the dataset: ambient population tripled between 2016 and 2024.
Buckeye, Arizona (85396) in the outer Phoenix metro, and St. Cloud, Florida (34771) southeast of Orlando, reflect the same pattern in their respective metros. Ewa Beach, Hawaii (96706) is the outlier, a rapidly developing secondary community on Oahu experiencing some of the strongest suburban growth in the state.
For retail site selectors and franchise planners, these ZIP codes represent markets where infrastructure and commercial investment are running to catch up with rapid population expansion; high-opportunity geographies for concepts that can establish early presence ahead of competitive saturation.
Top 10 Sharpest-Declining U.S. ZIP Codes by Ambient Population (2016–2024)
The steepest declines are concentrated in a distinct set of geographies: large-scale urban commercial and office cores, university-adjacent zones affected by campus disruption, legacy industrial corridors, and one state capital government district. Many of the sharpest drops reflect the structural effects of remote work on geographies that were formerly sustained by large daytime office or institutional populations.
Rank | ZIP Code | Location | 2016 Ambient Pop. | 2024 Ambient Pop. | 8-Year Change |
1 | 10038 | Lower Manhattan (Financial District), NY | 25,348 | 3,629 | −85.7% |
2 | 10032 | Washington Heights, Manhattan, NY | 38,768 | 6,398 | −83.5% |
3 | 75251 | Dallas (LBJ Freeway Corridor), TX | 11,905 | 2,670 | −77.6% |
4 | 96850 | Downtown Honolulu, HI | 42,311 | 13,300 | −68.6% |
5 | 95969 | Paradise/Olivehurst, CA | 24,658 | 8,503 | −65.5% |
6 | 10039 | Washington Heights, Manhattan, NY | 12,588 | 4,900 | −61.1% |
7 | 10007 | Lower Manhattan (City Hall), NY | 85,290 | 33,907 | −60.2% |
8 | 48915 | Lansing, MI (Capitol District) | 25,294 | 10,521 | −58.4% |
9 | 75246 | Dallas (Deep Ellum / Fair Park), TX | 10,969 | 4,682 | −57.3% |
10 | 10040 | Washington Heights / Inwood, Manhattan, NY | 40,764 | 17,604 | -56.8% |
The steepest declines are concentrated in a distinct set of geographies: large-scale urban commercial and office cores, legacy industrial corridors, and one state capital government district. Four of the ten sharpest declines belong to Manhattan ZIP codes, forming a coherent pattern of daytime activity dispersal from New York City's historically dense commercial and residential corridors. Many of the sharpest drops reflect the structural effects of remote work on geographies that were formerly sustained by large office populations, a shift that shows up in ambient data long before it registers in residential counts.
Lower Manhattan ZIP codes (10007, 10038) recorded severe declines of 60–86%, consistent with the documented collapse of daytime office populations in the Financial District and surrounding areas following the shift to remote work. Downtown Honolulu (96850) recorded a 68.6% decline, reflecting both tourism disruption during the pandemic period and structural changes in the city’s commercial activity patterns.
ZIP code 95969 covering the Paradise/Olivehurst area of California is likely influenced by the 2018 Camp Fire - one of the most destructive wildfires in California history - which displaced large numbers of residents and workers from the surrounding area.
For site selectors and territory planners, the decline ZIP codes represent geographies where ambient population-based opportunity assessments have changed materially since 2016 - and where census-based data, which captures residential population rather than daytime activity, may significantly overstate current market conditions.
What This Data Means for Location Decisions
Ambient population data at the ZIP code level reveals patterns that residential population figures alone cannot. The fastest-growing ambient geographies in the United States are not the cities themselves but the rapidly developing suburban and exurban corridors absorbing metro expansion. The sharpest declines are concentrated in urban commercial cores, institutional zones, and geographies affected by structural disruption.
For franchise territory design and retail site selection, these differences are critical. A territory defined by census data in a declining ambient ZIP code will overstate the available customer base - the residents are there, but the daytime economic activity that drives retail demand may have dispersed. A territory in a high-growth ambient ZIP code may be underdeveloped relative to its current population concentration, with commercial supply still catching up to the growth in demand.
The full ranked dataset of 33,791 U.S. ZIP codes by LandScan ambient population - including 2016 and 2024 figures and eight-year growth calculations - is available to Population Explorer Pro or Enterprise subscribers directly within the platform. Pro or Enterprise subscribers can draw territory boundaries, overlay ambient population data at ZIP code level, and compare historical growth trends as part of their site selection and territory design workflow.
About the Data
This analysis uses LandScan population data developed by Oak Ridge National Laboratory. LandScan models the average spatial distribution of human activity across 24-hour periods using land cover, transportation infrastructure, settlement patterns, road networks, nighttime lights, and census and administrative population inputs. It is designed to approximate ambient human presence - where people are throughout the day - rather than residential location alone.
The dataset covers 33,791 U.S. ZIP code tabulation areas. ZIP codes with zero or near-zero population in either reference year were retained in the full dataset but excluded from growth and decline rankings. A minimum 2016 ambient population floor of 10,000 is applied to all growth and decline rankings presented in this report.
Ready to do more?
Explore ambient population data at zip code level for any location in the USA and compare growth trends alongside residential population, household income, and competitor density. Start for free or Go Pro for the full ranked dataset of all USA zip codes


