
The cornfield effect is a systematic error in demographic analysis that occurs when census data attributes population to uninhabited areas (e.g., farmland, parks, industrial zones) within a census boundary. This distortion leads to overestimates of customer density and misguided location decisions with notable, negative impacts on franchise territory design and retail site selection. Constrained population models, such as WorldPop Global 2, eliminate the cornfield effect by assigning population only to areas where human settlements have been confirmed to exist.
Why Population Data Is the Foundation of Location Decisions
Anyone who has driven in and out of a major city knows one incontrovertible fact: populations are not evenly distributed. From the hyper-dense cores of city centres to the wide-open roads of suburban and rural regions, heterogeneity in population distribution is observable in just about every geography worldwide.
This matters enormously for retail and franchise decisions. Your prospective customer base will never exceed the population base of your geography. It’s mathematically impossible. Which is why franchisors designing territory maps and retailers selecting new locations focus so heavily on underlying population density: the higher the population, the larger the pool of prospective customers. Getting population data right is a prerequisite for every other location decision. It is also the first of the three factors that determine franchise territory performance. Without accurate population data, neither of the other two factors (competitive density and area earning power) can be properly evaluated in context.
Why Census Data Has Real Limitations
Census data, collected by governments the world over, remains the foundational reference for population counts and is rightly respected as such. Nothing fully replaces direct enumeration. But census datasets carry two well-documented limitations that become significant problems in site selection and territory design: they are spatially coarse, and they are infrequently updated.
The update problem
Most national censuses are conducted once per decade. In the US in 2025 alone, nearly 15 million residents relocated. If that rate continues, by the time the next decennial census is completed, a significant proportion of the population will have moved since the last count. Retail site selectors and franchise planners relying on decade-old data are working with a map of where people used to be, not where they are today.
The resolution problem
Census data does not tell you how many people live on a given street, or in a given neighbourhood. To conduct a census efficiently, national statistics agencies divide a country into manageable geographic units: Enumeration Areas in South Africa, Census Blocks in the United States, and IRIS units in France, among others. The census reports a single population count for each of these units as a whole.
The problem is that these units vary enormously in size and composition. A single census block may contain dense residential housing in one corner, a golf course in another, and a stretch of agricultural land beyond that. The census will report one combined population figure for the entire block — but it will not tell you where within the block those people actually live.
What Is the Cornfield Effect?
The cornfield effect is what happens when a site selector or territory planner uses census block data to identify a high-population area, then considers placing a location anywhere within that block, including the parts where nobody actually lives.
Here is a real example. Consider a census block in Cook County, Illinois, with a reported population of 4,742. On a population density map, this block appears attractive: sufficient people, sufficient density. A location within this boundary seems reasonable.
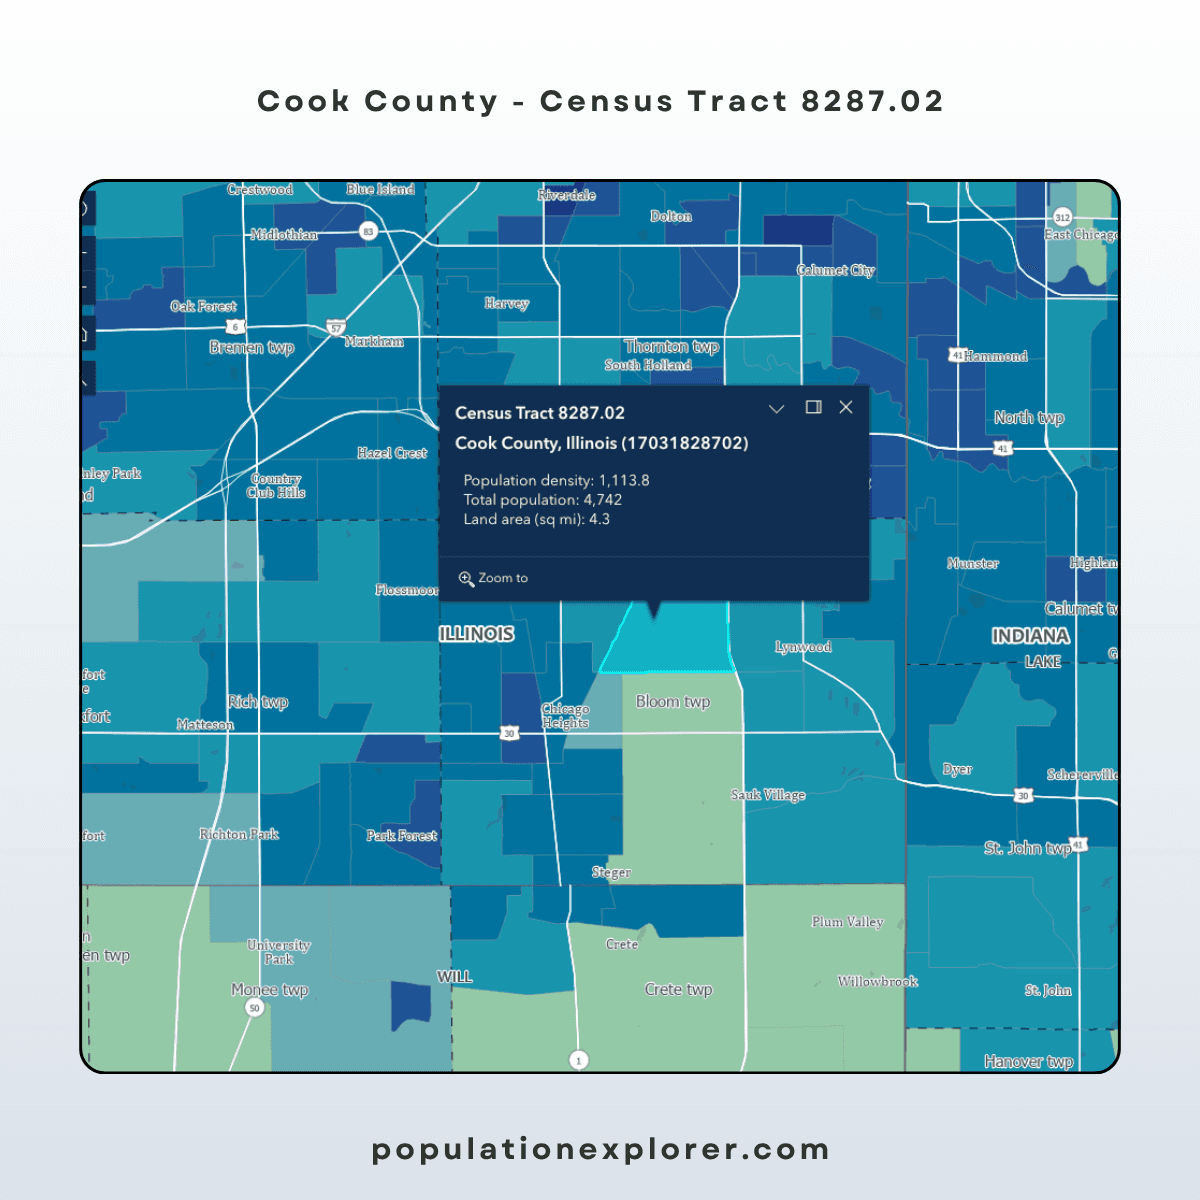
Now look at the same geography in satellite view. Approximately 90% of the area is greenspace: golf courses, public parks, recreational land. The 4,742 residents are real — but they are clustered into a narrow band of suburban residential tracts in one corner of the block. The rest of the area has no population at all.
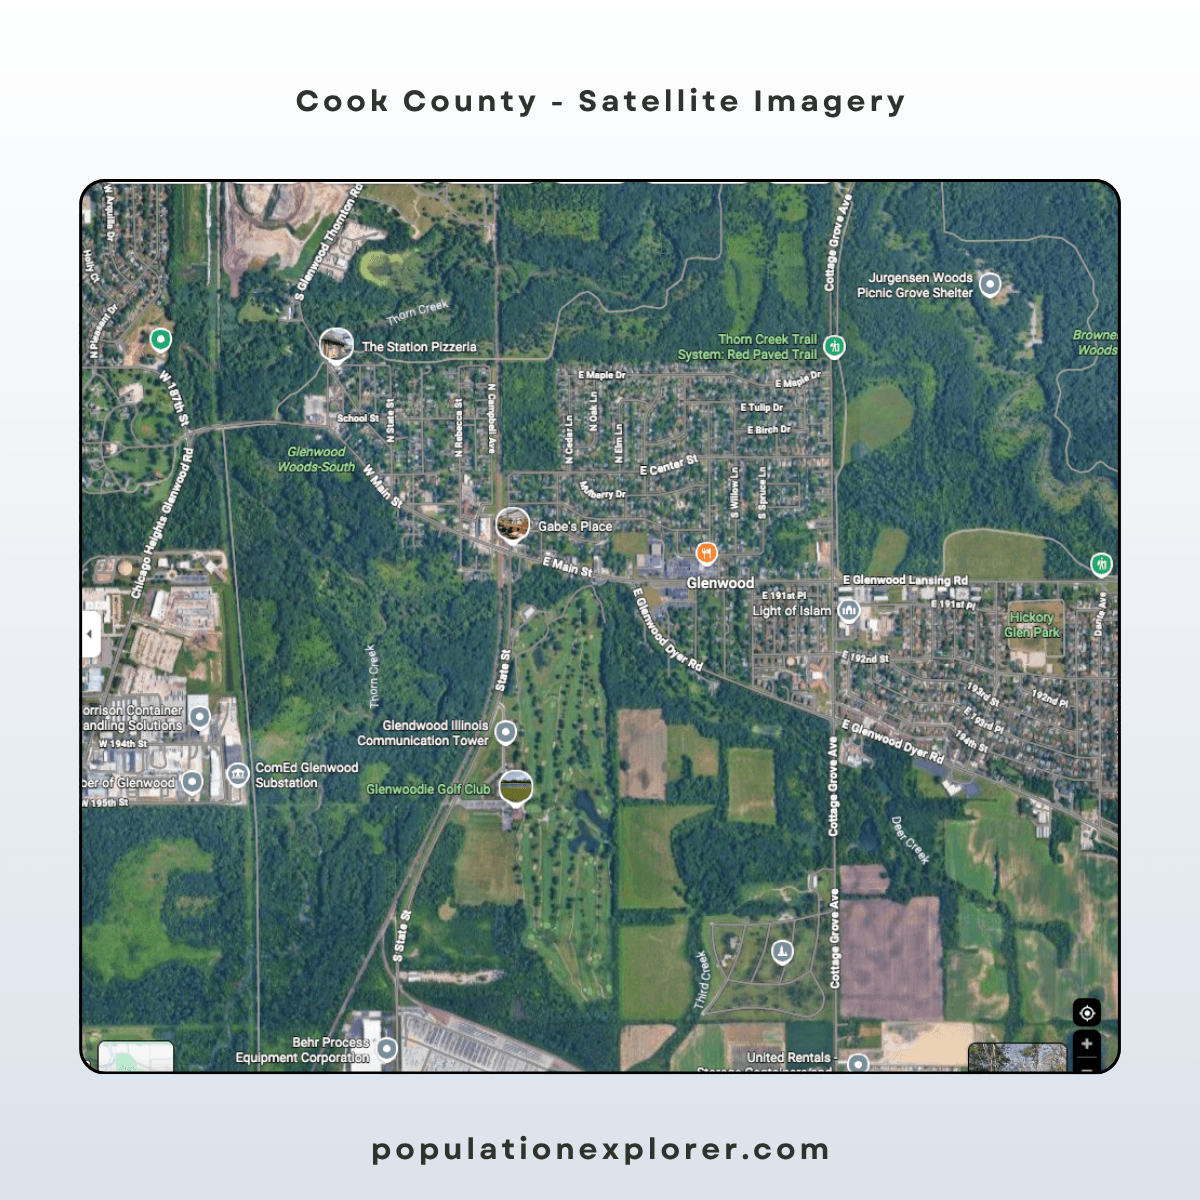
The census was not wrong. There are 4,742 people in that block. But the census data cannot tell you that placing a restaurant in the centre of that block puts you in the middle of a golf course, a kilometre from the nearest customer.
This is the cornfield effect: population data that is accurate at the block level, but systematically misleading at the location level because it cannot distinguish between where people live and where they don’t.
Why the Cornfield Effect Matters for Franchise and Retail Decisions
Successful franchise territory design, or retail site selection more generally, depends on accurately measuring three things: the density of your potential customer base, the competitive landscape and the economic strength of an area. The cornfield effect drastically erodes the quality of your customer base estimations, in two specific ways:
Overestimated territory potential. A territory that appears to contain 80,000 people based on census block totals may actually have far fewer residents in the areas the franchisee can practically serve, because a significant portion of the block population lives outside the commercially viable zone.
Mislocated sites. A site within a high-density census block may, in reality, sit adjacent to a park, a car park, or an industrial zone. The block’s population may be accurate while the population proximity to the candidate site is not.
Both errors compound over time. Territories awarded on inflated census-block estimates lead to franchisee disputes. Sites selected based on block-level density rather than actual residential proximity underperform. The data wasn’t wrong, it was just the wrong tool for the question being asked.
Historically, market researchers and territory planners absorbed these error rates as an occupational hazard, because few practically viable alternatives existed. Territory workflows paired imprecise desk research with expensive, intensive site visits to validate assumptions in the field. Now, there is no single dataset that can or should replace boots-on-the-ground site visits; in-person visits prior to final commitment provide critical, unique perspectives. But with settlement-constrained population data available at 100-metre resolution, significantly more of the analytical work can now be done remotely, narrowing candidate areas to those genuinely worth visiting. Fewer wrongheaded site visits means less expensive territory planning, and more effective decisions in the long-run.
How Settlement-Constrained Modeling Eliminates the Cornfield Effect
The cornfield effect exists because census data reports population at the boundary level, with no information about distribution within that boundary. The solution is a different class of population dataset: one that disaggregates census counts down to the level of individual settlements.
Population Explorer is built on two datasets specifically designed to eliminate this problem.
WorldPop Global 2 uses a settlement-constrained modelling approach developed at the University of Southampton, aligned to UN World Population Prospects 2024. Rather than reporting a single count for a census boundary, WorldPop disaggregates that count into 100-metre grid cells — assigning population only to cells where built settlements have been confirmed to exist via satellite imagery. Farmland, parks, golf courses, and industrial zones receive zero population attribution, because nobody lives there. The result is a population map that shows not just how many people are in a given area, but precisely where within that area they actually live, at 100-metre resolution globally.
LandScan (developed by Oak Ridge National Laboratory) takes a complementary approach, modeling 24-hour ambient population — where people actually are throughout the day, not just where they sleep. For retail and franchise applications, this distinction matters: a commercial district may have relatively few residents but enormous daytime population from commuters, workers, and shoppers. LandScan captures that movement. Census data does not.
Together, these two datasets give franchise planners and retail site selectors a fundamentally different view of population: one that reflects where people actually live and actually go, rather than where a census boundary happens to fall.
100-Metre Resolution vs. Census Block Groups: What the Difference Looks Like in Practice
To understand why resolution matters, consider the geographic scale of the units being compared.
A US Census block group contains an average of 1,500 people and covers a variable geographic area. In dense urban cores, block groups may be small. In suburban and rural areas, they can be large enough to encompass several distinct neighbourhoods, commercial zones, and uninhabited land simultaneously.
In South Africa, an Enumerator Area can average approximately 12 km² nationally, with urban EAs still spanning several city blocks. When a franchisor is deciding whether to place a location on this corner versus that corner 300 metres away, an EA-level population count cannot help. The two locations fall within the same boundary, and the data treats them identically.
WorldPop resolves population at 100 metres. That is 100 metres × 100 metres per grid cell, globally, with population assigned only to cells containing confirmed built settlement. At that resolution, the difference between a residential street and the park behind it is visible in the data. The cornfield effect is, by construction, eliminated.
What This Means for Your Territory Maps and Site Selection Decisions
If your territory maps or site selection analyses are built on census block data, the cornfield effect is almost certainly present. It may not be obvious: a block with 4,742 people still looks like a block with 4,742 people on a density map. But the question your location decision depends on is not how many people are in the block. It is how many people are within reach of the specific location you are evaluating.
Population Explorer gives franchise planners and retail site selectors access to WorldPop and LandScan data directly in the platform. Draw a drive-time territory or retail trade area, and the population count you see reflects the people who actually live and move within that boundary, not the people in whichever census block the boundary happens to overlap.
The census tells you how many people are in the block. PopEx tells you how many are in your market. Those are not the same number.
Ready to start?
You can create franchise territories yourself using high resolution WorldPop Global 2, or Landscan data in Population Explorer, or you can send us your locations and have us mock up a territory map for you.
Same price, data and quality outputs.
Choose whichever path is easier, and we’ll help you get it done.
Need more information? Read more about how population density fits into the broader framework for territory design.
Explore expert articles, eCommerce guides, and the latest updates to help your business grow smarter and sell better with Unistore.
Jun 26, 2026
The Cornfield Effect
The cornfield effect is a systematic error in demographic analysis that occurs when census data attributes population to uninhabited areas (e.g., farmland, parks, industrial zones) within a census boundary. This distortion leads to overestimates of customer density and misguided location decisions with notable, negative impacts on franchise territory design and retail site selection. Constrained population models, such as WorldPop Global 2, eliminate the cornfield effect by assigning population only to areas where human settlements have been confirmed to exist.

May 22, 2026
You Can Create a Franchise Territory in Less Than 2 Minutes
Franchise territory mapping no longer has to mean expensive consultants, complex GIS software, or weeks of setup. Modern tools let franchisors create, evaluate, and compare protected territories in minutes.

May 22, 2026
At What Point Does a Franchise Need Territory Mapping?
Not every franchise needs rigorous territory mapping on day one. But once territory decisions begin affecting franchise sales, market protection, expansion planning, and long-term network value, the stakes change quickly.
