
Franchise territories are often evaluated by size or population, but performance is driven by three core factors: customer base, competition, and economic strength. This article outlines how franchisors use these factors to design, compare, and price territories with greater precision.
Introduction
Whether you are mapping, selling, or purchasing a new franchise territory, defining what constitutes a “good” territory can be a challenge. There are multiple software solutions, hundreds of datasets, and no shortage of consultants offering guidance. At the same time, the marketplace is unforgiving. Some locations perform. Others don’t. That makes clarity and confidence essential.
What we aim to do here is highlight the core attributes of a strong territory. The three components below are consistently present in locations that perform well. There are, of course, many additional factors that influence the final shape and structure of a franchise territory map, but without these fundamentals in place, even well-positioned territories tend to underperform.
Factor 1: Customer Base (Demand)
What it means
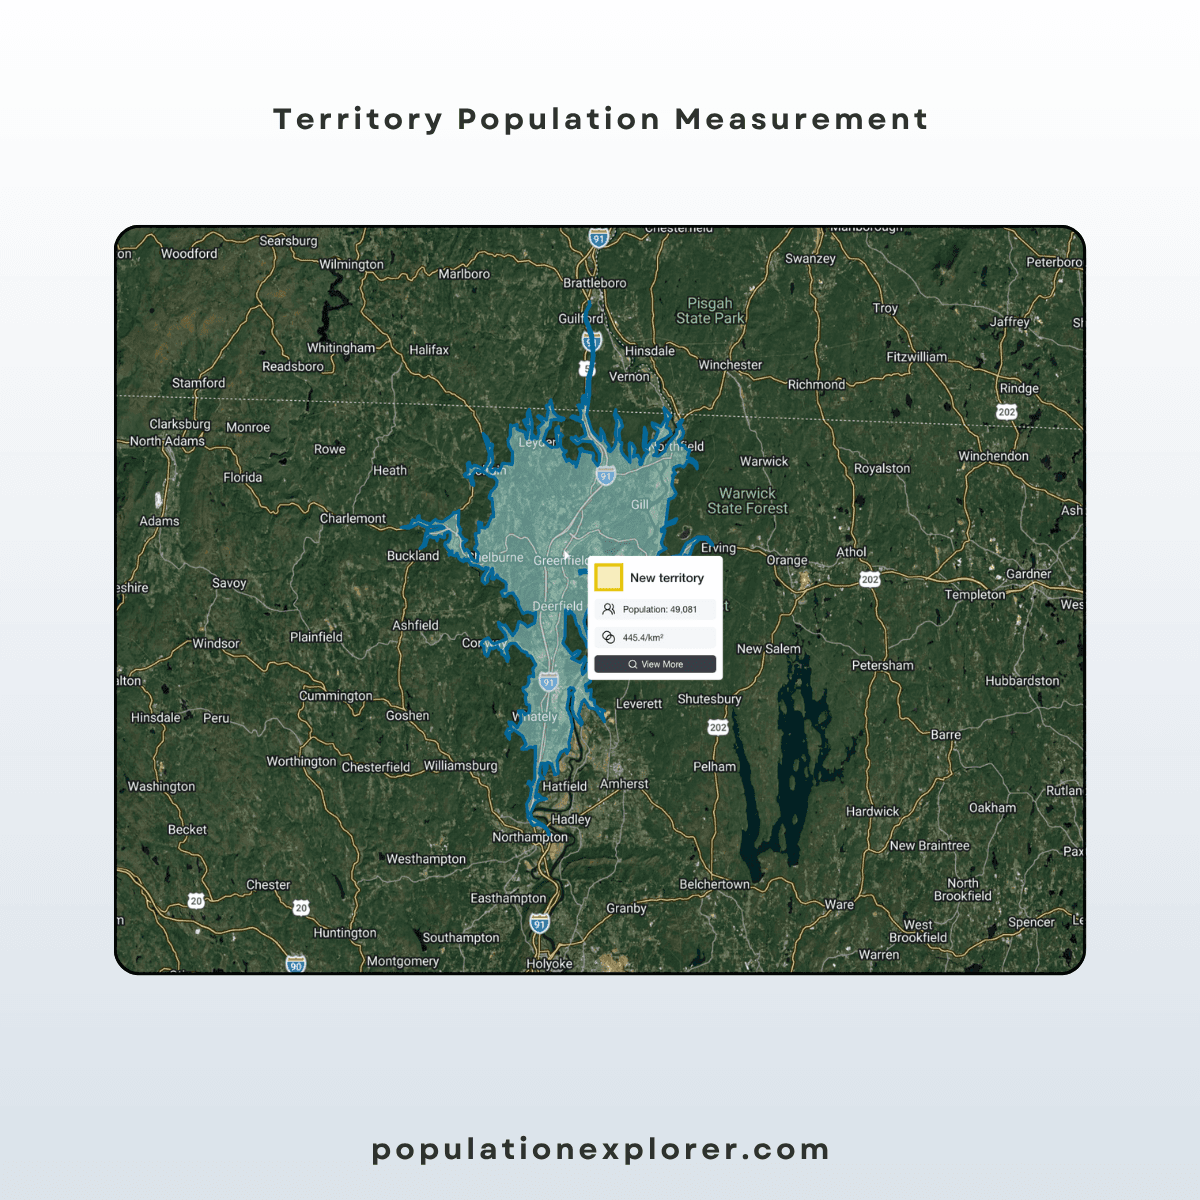
The customer base is the number of people a franchise territory or retail location can realistically serve. This typically includes either residential or daytime population, combined with a reachability factor such as travel time. To illustrate: a territory with 100,000 people spread across a wide area behaves very differently from one where that same population is concentrated in a few dense corridors. Why? Because customers prioritize convenience. If two locations offer the same experience, the one that is easier to reach will capture more demand.
What this means in practice, is that franchise territory maps ought to define a reachable customer base. Isochrones, or ‘travel-time boundaries’ are best suited for this.
It is also important to understand how the underlying customer population is measured. Many franchise territory mapping tools rely on census data, which reflects residential population, where people live. This can miss a large part of actual demand. Most people are mobile throughout the day. Where they work, commute, and spend time often differs from where they live. For many concepts, especially convenience-driven formats, daytime population is a better indicator of demand.
A complete view of the customer base includes both residential and daytime population, depending on the business model.
What to look for
Population density within equal travel-time boundaries, not fixed geographic units
High daytime population density for convenience and QSR formats
Residential population growth within the territory
Common mistakes
Focusing on geographic size rather than customer base size
Relying only on residential population measures
Selecting areas with flat or declining population trends
How it’s evaluated
Total population within the territory
Population within drive-time catchments
Daytime versus residential population differences
5-year population growth rates
Factor 2: Competition (Market Coverage)
What it means
Competition reflects how demand within a territory is already being served. In practical terms, how hard will you have to compete for customer attention?
Competitor density is a useful proxy for this. Areas with a higher concentration of direct competitors are typically more difficult markets than those with fewer competing options.
This is one reason franchisors prioritize whitespace opportunities when developing franchise territory maps. Areas with lower competitive density give new locations a clearer path to capturing demand.
Mapping competition includes:
Direct competitors
Your own existing locations (often referred to as cannibalization)
It can also include “ally” businesses. These are not competitors, but they indicate strong commercial activity and customer presence. For example, fitness brands may cluster near health-focused retail, while auto parts stores may align with used car dealerships.
The key point is that not all population within a territory is available demand. Some portion is already being served or influenced by existing locations.
What to look for
Areas where multiple competitors are serving the same population
Gaps where population exists but coverage is limited
Clusters of commercial activity that signal strong demand
Common mistakes
Evaluating territories without accounting for nearby locations
Ignoring overlap between territories and existing units
Assuming all population within a boundary is available demand
How it’s evaluated
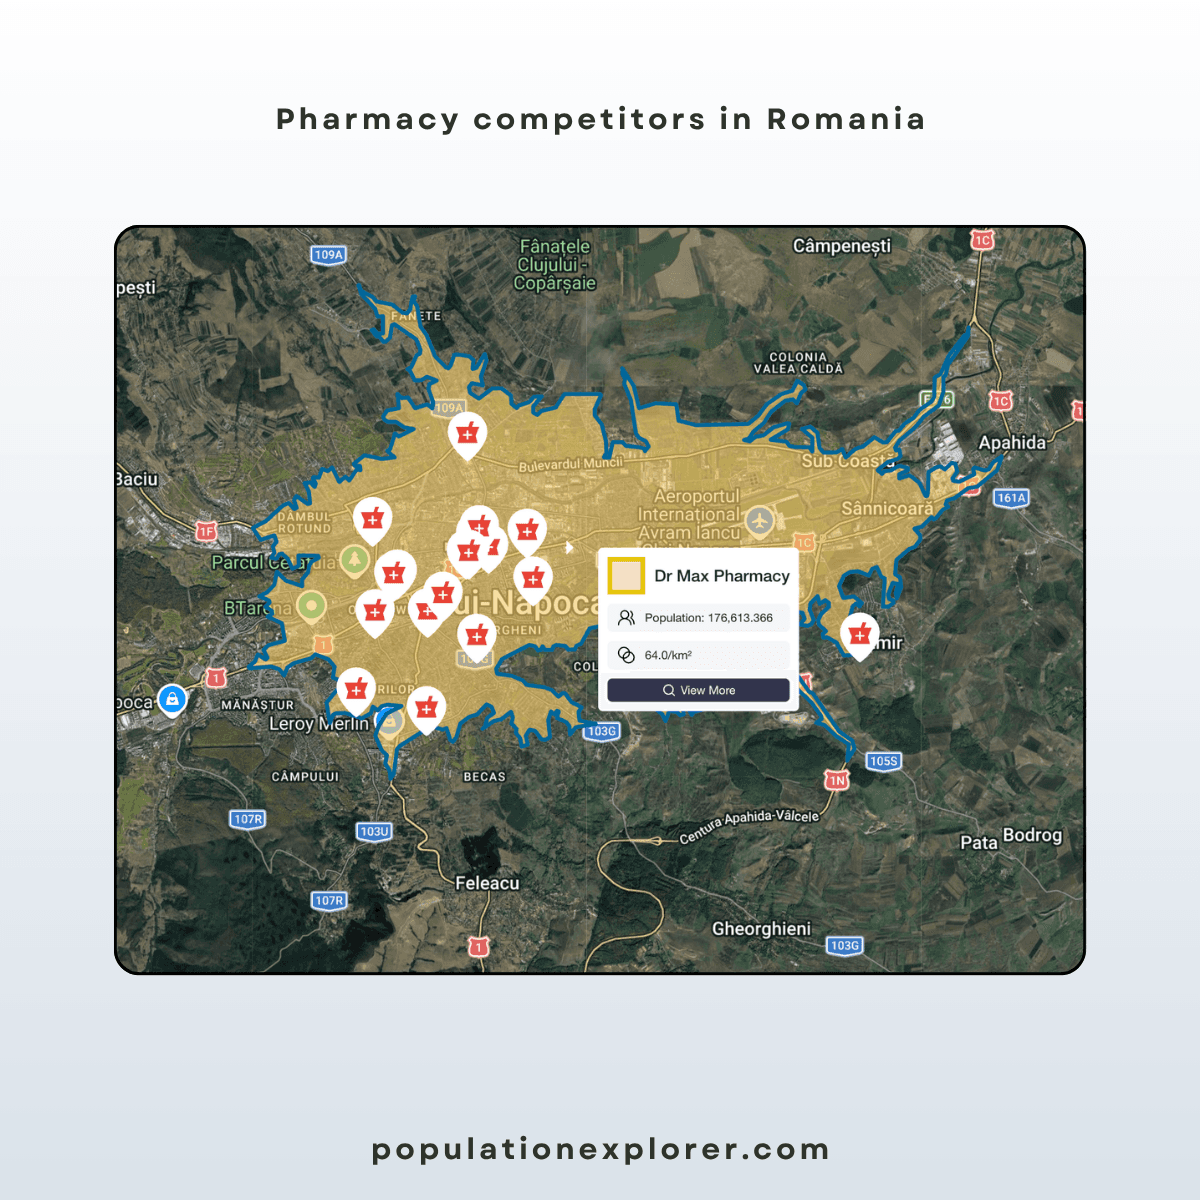
Mapping competitor and own locations within and around the franchise territory
Measuring proximity between locations and overlap in their reach
Calculating density indicators such as:
→ Competitor density: total competitors divided by total population
→ Ally density: total relevant businesses divided by total population
These metrics provide a consistent way to compare territories and understand how saturated a market is.
How this affects franchise territory mapping decisions
Competition changes how demand should be interpreted.
A high population territory with heavy competition may have limited room for expansion
A moderate population territory with lower competition may present stronger opportunity
Overlapping coverage between existing locations can reduce the effective customer base for each unit
Understanding competition helps identify where demand is already being served and where it is still available.
Factor 3: Economic Strength (Spending Power)
What it means
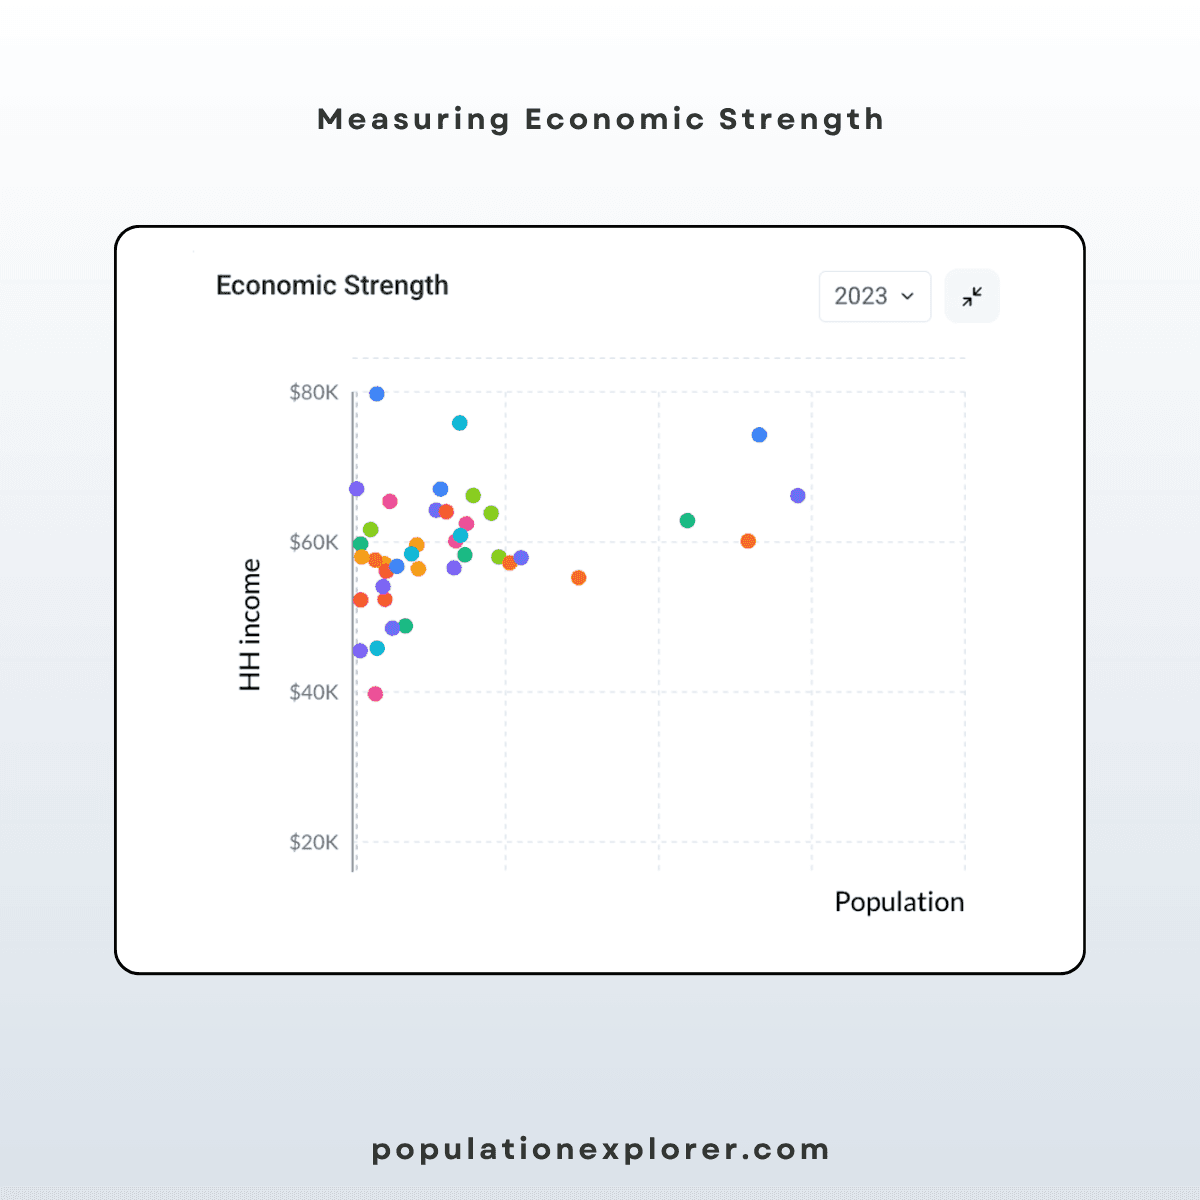
Economic strength reflects the ability of a geographic area to support a new franchise. Population size tells you how many potential customers exist, but not all populations have the same spending power. Income levels influence how often customers purchase, how much they spend, and whether a location can sustain itself.
Different brands prioritize different types of territories. A cost-focused retailer like Wal-Mart can succeed in areas with broad population and moderate income levels, while a premium brand like BMW requires a higher-income customer base.
In practice, economic strength is evaluated by combining population and income. A strong franchise territory is not just populated, but populated by customers who can support the business model.
What to look for
Income levels that align with the brand’s pricing and positioning
A combination of sufficient population and appropriate income levels
Alignment between daytime population and spending power for the concept
Common mistakes
Prioritizing population size without considering income, or vice versa
Assuming higher population volume will offset weaker spending power
How it’s evaluated
Median household income within the territory
Distribution of income across different areas
Combining population and income to estimate overall economic strength
Comparing economic strength across candidate territories
Income should be evaluated alongside population, not in isolation.
How this affects territory decisions
Economic strength shapes how demand converts into revenue.
High population with low income can limit performance
Moderate population with strong income can support higher-value concepts
Variability in income across a territory can create uneven performance within the same boundary
Understanding economic strength helps determine whether a territory can sustain the concept and how it should be positioned.
How the 3 Factors Work Together
No single factor determines whether or not a franchise territory map has identified strong or weak locations.
Strong territories align across all three:
A sufficient and accessible customer base
A level of competition that leaves room for growth
Economic conditions that support the business model
Looking at only one factor creates blind spots.
High population with high competition can limit opportunity
Moderate population with low competition can support expansion
High population with low income can constrain performance
The goal is not to maximize a single variable. It is to understand how these factors interact within each territory.
Applying the 3 Factors to Franchise Territory Decisions
The three factors are not meant to be evaluated in isolation. Strong franchise territory maps are defined by how demand, competition, and economic strength interact within the same area.
Looking at only one factor can produce misleading conclusions. A complete evaluation requires viewing all three together.
Step 1: Define the Customer Base
Start by identifying how many customers a territory can realistically support. Use travel-time boundaries to measure reachable population and determine whether residential or daytime population is more relevant for the concept.
At this stage, the goal is to establish a baseline:
How many customers are available
Where they are concentrated
Whether that customer base is growing or declining
This defines the potential of the territory before considering any external pressures.
[Links: how to measure daytime/ambient population; how to measure population growth rates; how to create a travel-time boundary]
Step 2: Adjust for Competition
Next, evaluate how much of that demand is already being served.
Search for competitor locations and existing units, categorize these as ‘competitors’ and assess how densely those locations are distributed relative to the population. Do the same for allies: search for complementary business offerings and categorize as ‘allies’. Each territory will have a different competitor or ally density, and this will have a big impact on your competitive impact.
This step reframes the initial demand:
A large customer base may already be saturated
A smaller customer base may have limited competition and stronger opportunity
Competitor density and ally density provide a consistent way to compare how contested different territories are. Closely related, you may also evaluate whitespace opportunities or network coverage by bulk-creating catchments for your saved competitors or allies.
Step 3: Validate Economic Strength
Once demand and competition are understood, evaluate whether the remaining opportunity is economically viable.
Combine population and income to determine whether the franchise territory can support the concept:
Does the population have the spending power required?
Is the income level aligned with the brand’s positioning?
At this stage, territories that appear similar in size or population often begin to separate in terms of expected performance.
How Franchisors Use These Factors To Design Successful Territories
When demand, competition, and economic strength are evaluated together, differences between franchise territories become much clearer. Two territories may appear similar when viewed by size or total population. After applying these three factors, they often separate quickly. One may have concentrated demand, limited competition, and strong income levels. The other may have dispersed demand, heavier competition, or weaker economic conditions.
These factors allow for a greater level of precision and transparency when assessing the value of a given franchise territory. And we see these insights creating real, measurable change in territory sizing/selling practices. For example:
Franchise territory boundaries are adjusted to reflect the customer base, not fixed geographic size. Areas with higher demand may support smaller, more concentrated territories, while lower-density areas may require broader coverage.
Candidate territories are compared using the same, transparent framework. Instead of relying on surface-level similarities, each territory is evaluated based on how demand, competition, and economic strength interact within that area.
Expansion opportunities become easier to identify. Gaps between population and existing coverage highlight where new locations can perform, particularly when those gaps align with strong economic conditions.
Apply These Factors To Your Own Franchise Territory Maps
Map your own territories using these three factors to understand how demand, competition, and economic strength vary across your network.
Or send a small set of locations and we will map these factors for you and highlight where territories differ in structure and opportunity.
Explore expert articles, eCommerce guides, and the latest updates to help your business grow smarter and sell better with Unistore.

Jul 27, 2026
UK Postcode Districts Ranked by Ambient Population: Growth Leaders and Decliners (2016–2024)
This report ranks UK postcode districts by ambient population using LandScan data covering 2016 to 2024. Ambient population measures where people actually concentrate throughout the day, across employment, commuting, retail, logistics, and commercial activity, rather than simply where they sleep at night.

Jul 24, 2026
U.S. ZIP Codes Ranked by Ambient Population: Growth Leaders and Decliners (2016–2024)
This report ranks U.S. ZIP codes by ambient population using LandScan data covering 2016 to 2024. Ambient population measures where people actually concentrate throughout the day - across work, commuting, tourism, retail, and commercial activity - rather than simply where they sleep at night. The rankings reveal a dramatic divergence between fast-growing Sunbelt suburban corridors and declining urban cores, university zones, and legacy commercial districts.

Jul 24, 2026
How to Choose the Right Boundary Type for Your Franchise Territory
The boundary type you choose for a franchise territory determines how disputes get resolved, how equitably franchisees are treated, and whether your FDD holds up under scrutiny for the life of the agreement. Zip codes, administrative boundaries, radius buffers, and drive-time isochrones each serve different purposes. The right choice depends on your concept, your market, and what you need the boundary to do.
