
We analyzed 3,200+ Jersey Mike’s locations across the U.S. to understand how population density influences retail site selection and territory spacing. The data reveals a clear pattern: denser markets support more locations with tighter spacing, while lower-density markets require broader coverage.
How does Jersey Mike's manage expansion?
There’s a tendency in retail site selection to overcomplicate things. Advanced models, detailed scoring systems, highly specific heuristics.
Those can be useful. But they won’t compensate for weak fundamentals.
In our recent piece on retail site selection, and throughout our work in franchise territory mapping, we outline three factors that consistently show up in high-performing locations:
population
household income
surrounding businesses (competitors, anchors, co-tenants)
This analysis focuses on the first of those: population.
We looked at Jersey Mike’s as a case study to see how a rapidly expanding brand aligns its network with underlying population.
What we analyzed
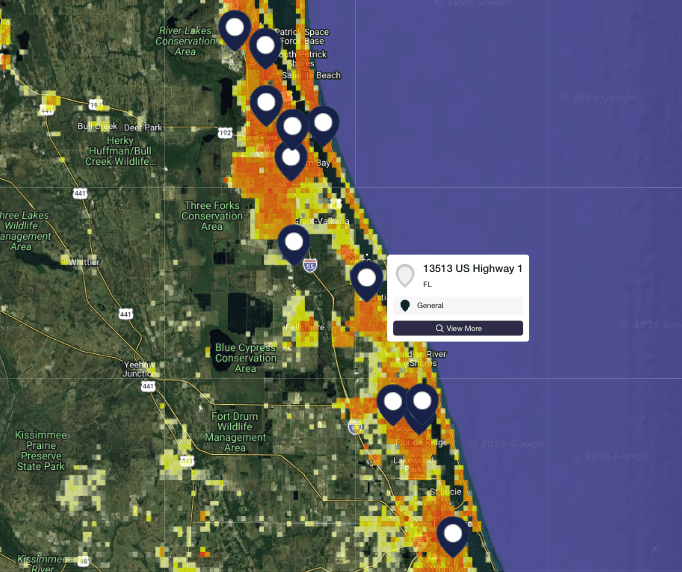
We compiled a dataset of ~3,200 Jersey Mike’s locations across the U.S. and evaluated each site using a consistent 15-minute drive-time catchment.
For each location, we measured:
total ambient population (LandScan)
catchment area
distance to the nearest Jersey Mike’s
The goal was not to evaluate individual sites, but to understand how the network is structured at a national level. In short, we wanted to answer a simple question: as Jersey Mike’s expands, how does it decide when and where to add more stores?
Population varies significantly across “similar” trade areas
A 15-minute drive-time is often used as a standard unit in site selection. In practice, it is not comparable across markets. Across the Jersey Mike’s network, population within a 15-minute catchment ranges from roughly 30,000 to over 3 million people.
The median is about 210,000, with a wide distribution on both sides.
This means that two stores operating under the same nominal trade area can be serving very different underlying demand.
Store spacing adjusts with population
When you look at the distance between nearby Jersey Mike’s locations, a consistent pattern emerges.
In higher-density markets:
stores are typically 2–3 miles apart
15-minute catchments often contain 400,000 to 2M+ people
In lower-density markets:
spacing increases to 10–20 miles
catchment populations are more often in the 50,000–150,000 range
This relationship holds across regions and is one of the clearest structural features in the data.
As population increases, store spacing decreases. As population decreases, spacing increases. This is the same principle that underpins effective territory mapping and trade area planning.
Higher-density markets support tighter clustering
In markets where population is sufficiently high, the network shifts from coverage to density. Rather than expanding outward, additional locations are placed closer together.
This results in:
shorter distances between stores
smaller individual catchments
higher population density within each catchment
This is consistent with a model where convenience and access become more important once baseline demand is strong.
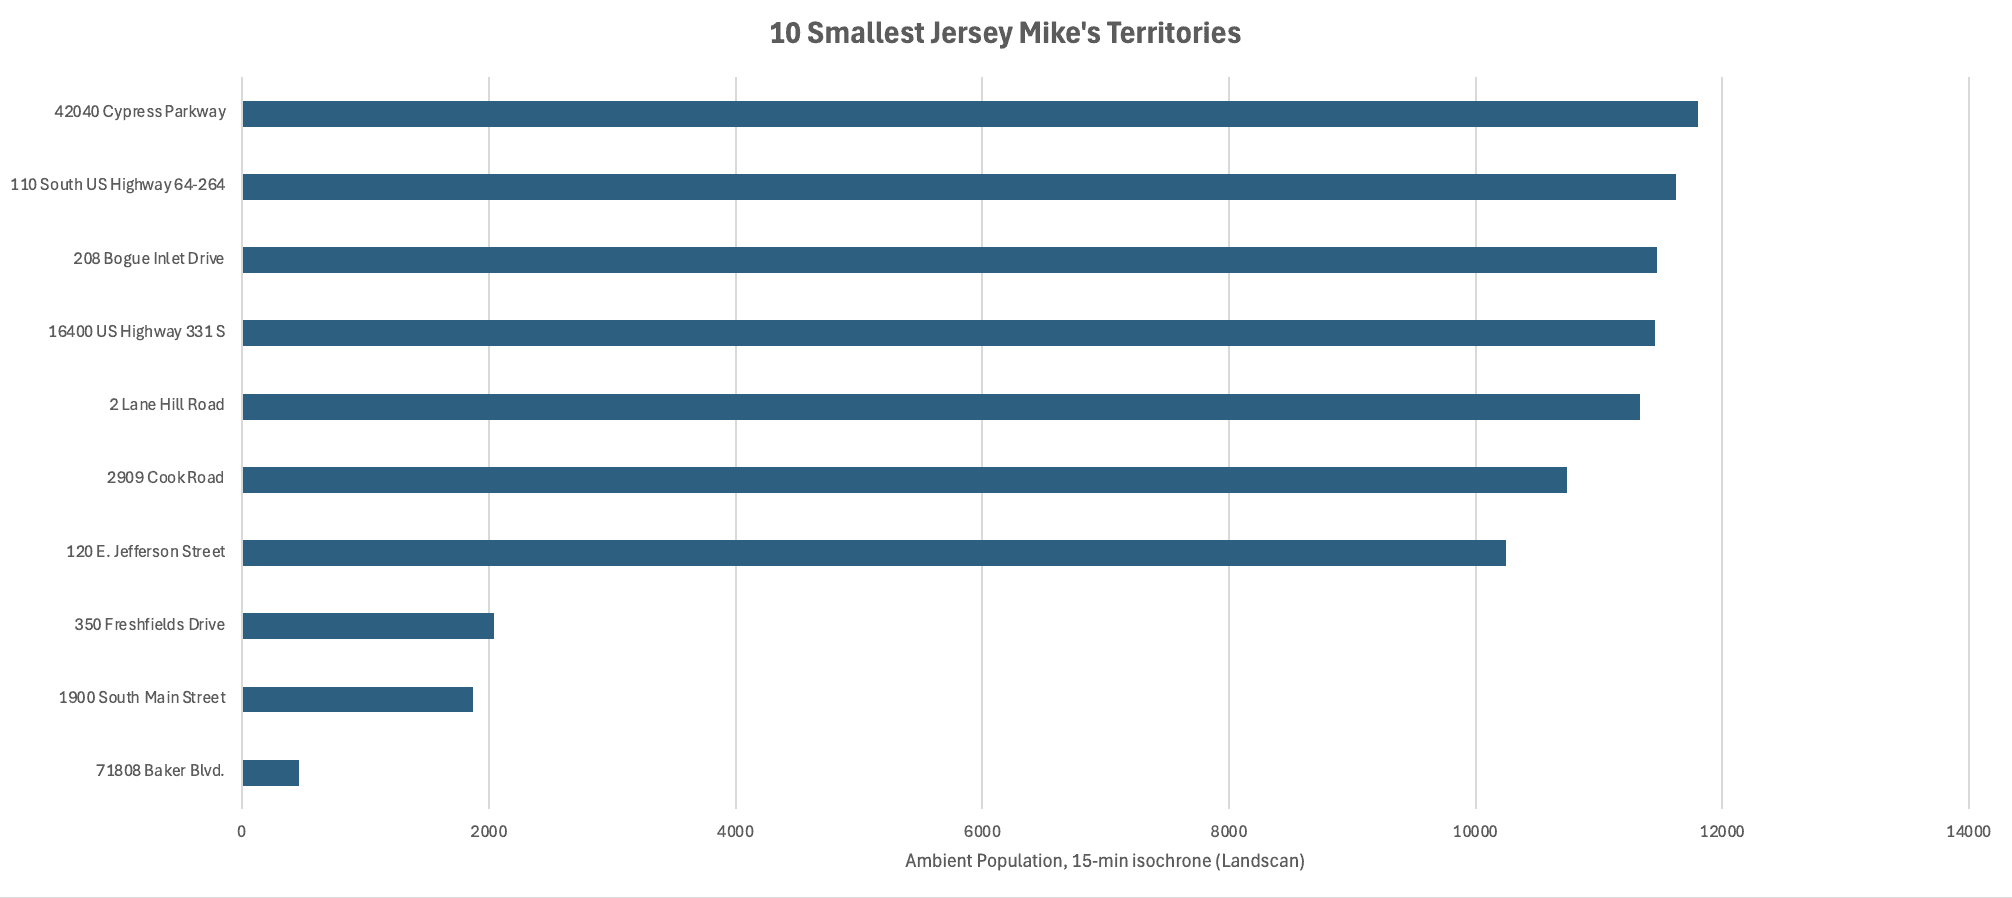
The range of territory density is large
The difference between the highest- and lowest-population catchments is substantial.
The top 10% of locations have roughly 28x more population in their trade areas than the bottom 10%.
This is not a marginal difference. It reflects fundamentally different operating environments across the network.
Implications for site selection
The main takeaway from this analysis is straightforward. Jersey Mike’s appears to align its store density with underlying population.
Higher population markets support more locations in closer proximity
Lower population markets support fewer locations with wider spacing
This is not a complex model, but it is consistently applied.
For operators and franchisors both, the implication is that site selection decisions should start with a clear view of population:
how much demand exists within a realistic catchment
how that demand is distributed
and how many locations it can reasonably support
(for franchisors, this evolves into a wider territory mapping problem - i.e., how to create and protect territories for individual franchisees)
More detailed factors - income, co-tenancy, competition - may build on that foundation, but will never replace it.
Context: the other two factors
Population is one part of the picture.
The other two factors we see repeatedly in high-performing locations are:
household income, which influences spending power
surrounding businesses, which shape demand, traffic, and positioning
We cover all three in more detail here:
👉 Retail Site Selection: The 3 Factors That Actually Determine a Winning Location
Closing
This analysis does not attempt to infer Jersey Mike’s internal decision-making process. It does show that, at a network level, their expansion aligns closely with population distribution.
For most brands, that alignment is a necessary condition for sustained growth.
Evaluate your own territories the same way
Map your trade areas, measure population, and understand how many locations your markets can actually support.
Go to the map →
Access to the Jersey Mike's Dataset
We’ve made the full Jersey Mike’s dataset available as a CSV download.
If you’d like a copy, send us a quick note and we’ll share it.
Next up:
Explore expert articles, eCommerce guides, and the latest updates to help your business grow smarter and sell better with Unistore.

Jun 26, 2026
The Cornfield Effect
The cornfield effect is a systematic error in demographic analysis that occurs when census data attributes population to uninhabited areas (e.g., farmland, parks, industrial zones) within a census boundary. This distortion leads to overestimates of customer density and misguided location decisions with notable, negative impacts on franchise territory design and retail site selection. Constrained population models, such as WorldPop Global 2, eliminate the cornfield effect by assigning population only to areas where human settlements have been confirmed to exist.

May 22, 2026
You Can Create a Franchise Territory in Less Than 2 Minutes
Franchise territory mapping no longer has to mean expensive consultants, complex GIS software, or weeks of setup. Modern tools let franchisors create, evaluate, and compare protected territories in minutes.

May 22, 2026
At What Point Does a Franchise Need Territory Mapping?
Not every franchise needs rigorous territory mapping on day one. But once territory decisions begin affecting franchise sales, market protection, expansion planning, and long-term network value, the stakes change quickly.
