Retail Site Selection
Most retail location decisions look rational on the surface, but fail for predictable reasons.
A site looks promising. There’s visible activity, decent surrounding demographics, maybe even nearby retail that suggests demand. But a few months later, performance doesn’t match expectations. Foot traffic is weaker than anticipated, conversion is inconsistent, or competition turns out to be more aggressive than it first appeared.
The issue often isn’t a lack of data, it’s how that data is prioritized.
The Problem with Most Retail Site Selection Strategies
There’s no shortage of advice on how to choose a retail location. Some frameworks emphasize income. Others focus on anchor tenants or identifying underserved areas. Each of these perspectives can work, but they rarely combine into a consistent way of evaluating a location as a whole.
As a result, retail site selection becomes fragmented. One location looks strong because of income. Another looks promising because of population density. A third appears attractive because there are few competitors nearby.
Without a clear framework, decisions drift toward intuition or, worse, guesswork.
The 3 Forces That Actually Drive Retail Performance
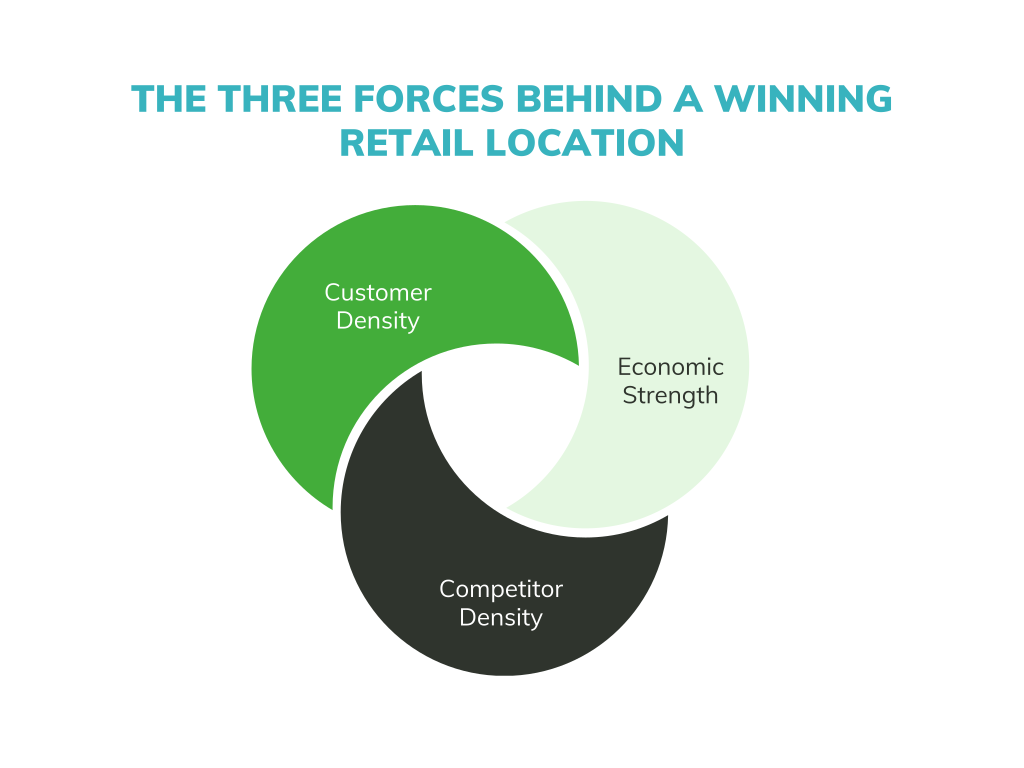
In practice, retail performance is driven by three underlying forces. You can layer in additional datasets, but if you misread any of these, the location is unlikely to perform.
Those forces are:
Customer density - Are there enough people nearby?
Economic strength - Can they actually spend?
Competitive pressure - Who else is capturing that demand?
The goal is to understand how they interact and bring collective strength to site selection decisions, so you can evaluate prospective retail sites with confidence.
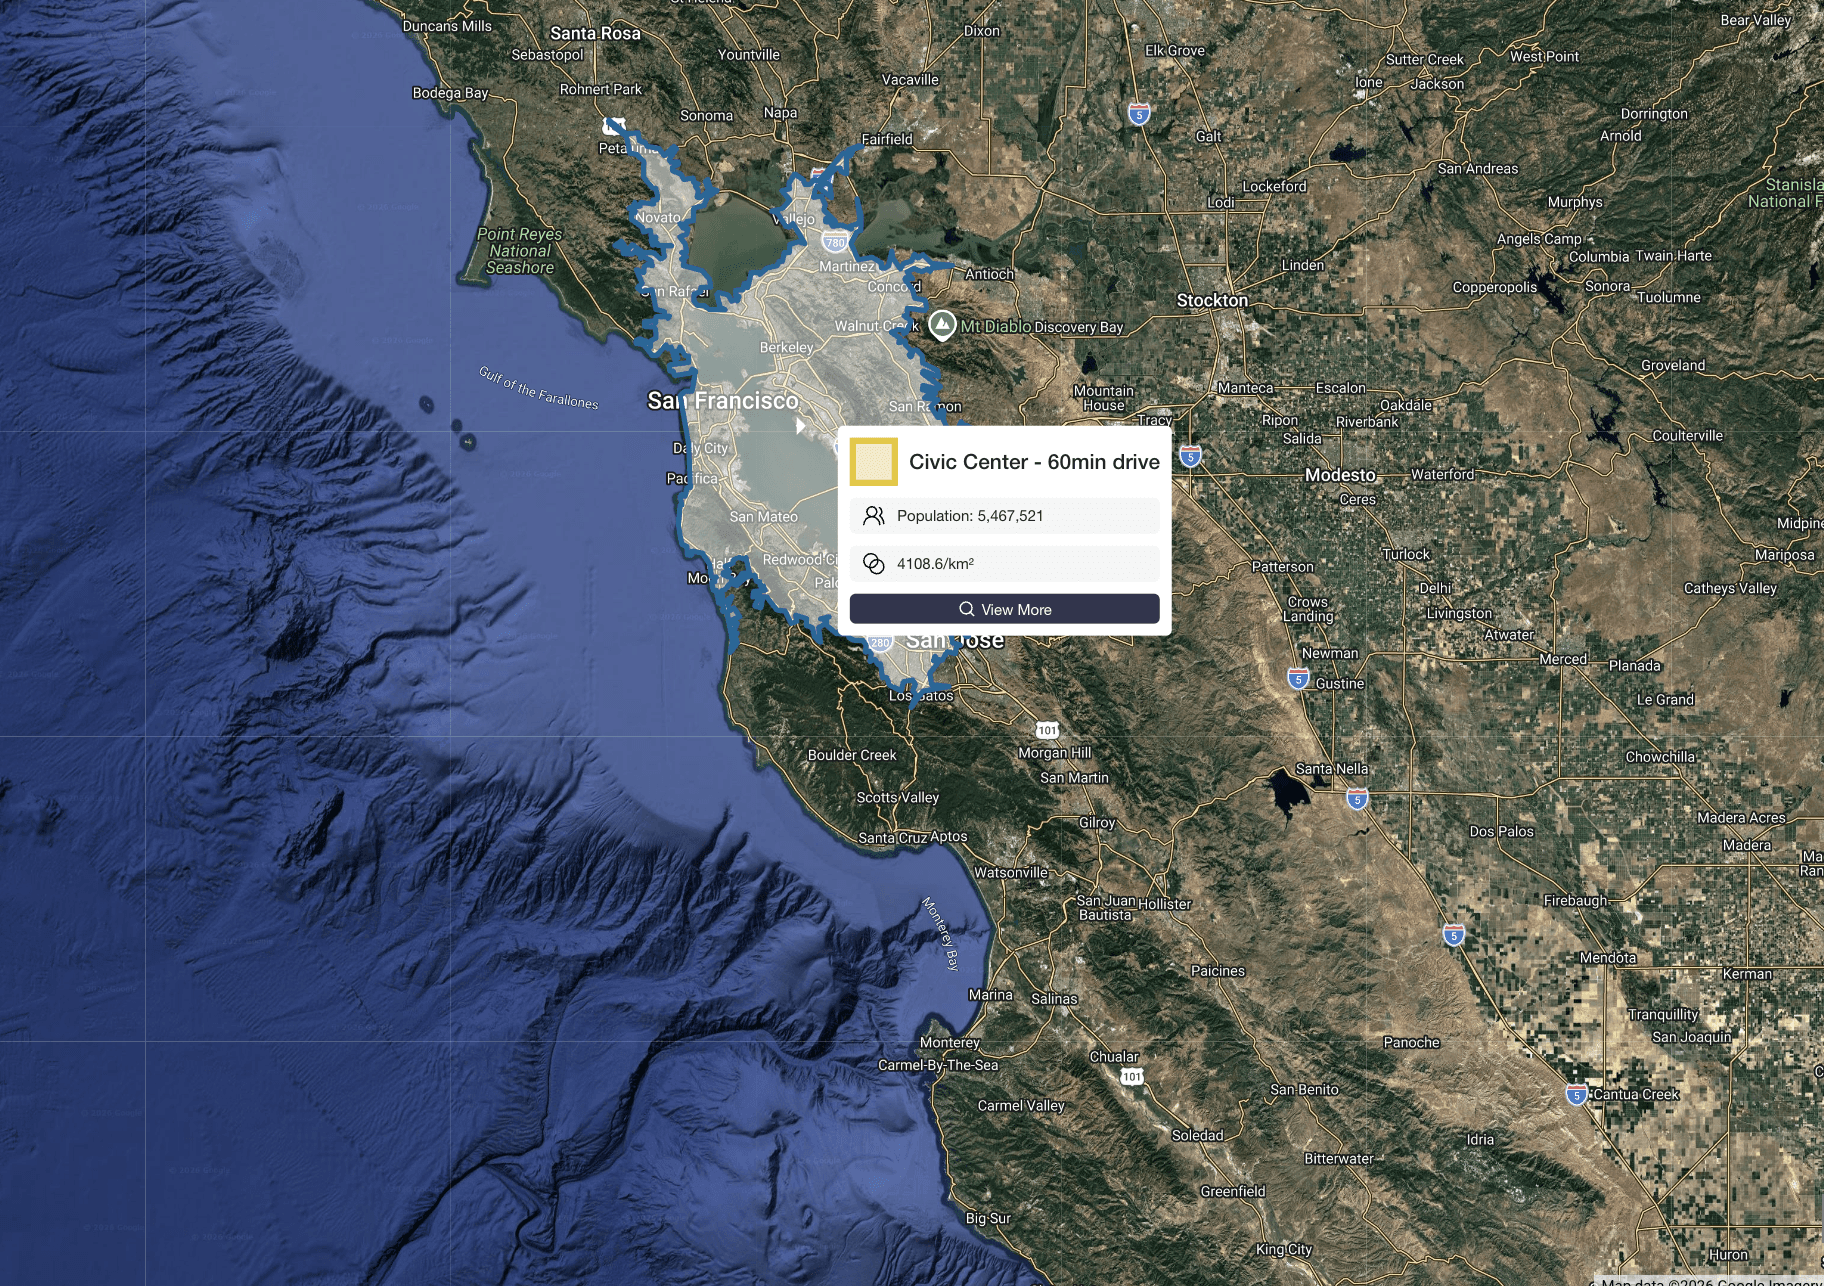
You can test this directly for your own sites by drawing a trade area and comparing population, income, and competition in Population Explorer. Go to the map →
Customer Density: Where Is the Demand Actually Located?
Population is often treated as a single number, but in reality it shifts throughout the day. Residential areas empty as people commute to work, while commercial areas fill in. This movement can dramatically change where demand exists during business hours.
A location that looks dense on paper may feel quiet during the day. Another that appears moderate residentially may have strong daytime activity because of nearby offices or transit flows. These variances make it difficult to confidently analyze trade areas.
This is why separating population into residential population and daytime population is critical. It allows you to understand not just where people live, but where they are present when your business is open.
Economic Strength: Can the Market Support Your Offering?
Population alone doesn’t determine performance. Two areas with similar density can behave very differently depending on income levels and spending capacity. A dense area with limited purchasing power may generate traffic but struggle to convert. Meanwhile, a slightly less dense area with stronger income levels may support higher-value transactions and more consistent performance.
The key question is simple:
Can the surrounding population realistically support your pricing and offering?
Understanding that alignment is what separates viable locations from misleading ones.
Competitor Density: Are You Entering a Vacuum or a Battlefield?
Competition is often treated as something to avoid, but in reality it provides critical context. At a high level, markets tend to fall into three patterns:
No competition → often signals weak or unproven demand
Moderate competition → indicates validated demand and opportunity
Heavy competition → suggests saturation and margin pressure
The goal isn’t to eliminate competition; it’s to understand what its presence means for your specific location.
Why Most Locations Fail
Most underperforming locations can be traced back to an imbalance across these three forces.
High population + low income → traffic without sales
Strong income + low density → insufficient volume
High demand + heavy competition → reduced share of market
Looking at any one factor in isolation creates blind spots. Performance depends on how they come together.
The Real Goal: Balance, Not Optimization
The goal of retail site selection is not to maximize a single metric. It’s to find locations where:
demand is present
customers can spend
competition is balanced
That intersection is what defines a winning location. Once these fundamentals are established, further investigation into granular real-estate opportunities within the trade area can be approached with confidence.
Bringing It Together
Population Explorer brings these three forces into a single workflow (read our step-by-step guide on choosing retail locations) allowing you to evaluate locations in context rather than in isolation. Instead of jumping between datasets or relying on assumptions, you can analyze:
where people are
what they can spend
how competition is distributed
All within the same view.
Try It Yourself
The fastest way to understand a location is to map it.
Start by mapping a few candidate locations and comparing how these three factors change across each one.
Go to the map →
Next Up:
→ How to find population in a radius, anywhere in the world
→ How to create a travel-time trade area
→ Learn more about Census, Daytime Population and WorldPop