
Cape Town is one of the world’s fastest-growing recreational markets, but pickleball infrastructure hasn’t kept pace. Using U.S. benchmarks and 15-minute catchment analysis, we show why Western Cape is materially undersupplied and where expansion opportunities exist.
Pickleball in Cape Town: An Undersupplied Market in the World’s Best City
Cape Town is one of the most attractive cities in the world - recently ranked #1 by Time Out in 2025 - with a strong tourism economy, a deep recreational culture, and a steady inflow of international visitors.
It’s also a city where global brands are actively investing. Companies like Amazon, Microsoft, and Unilever have expanded operations locally, while retail and lifestyle brands - from New Balance to Louis Vuitton and Gucci - are increasing their presence as demand grows.
That combination - global capital, local demand, and a rapidly evolving economy - has already pushed many sectors toward saturation.
Pickleball hasn’t followed that pattern.
Across the Western Cape, infrastructure has not kept pace with population - leaving a measurable gap large enough to support meaningful franchise expansion.
What a Built Market Looks Like
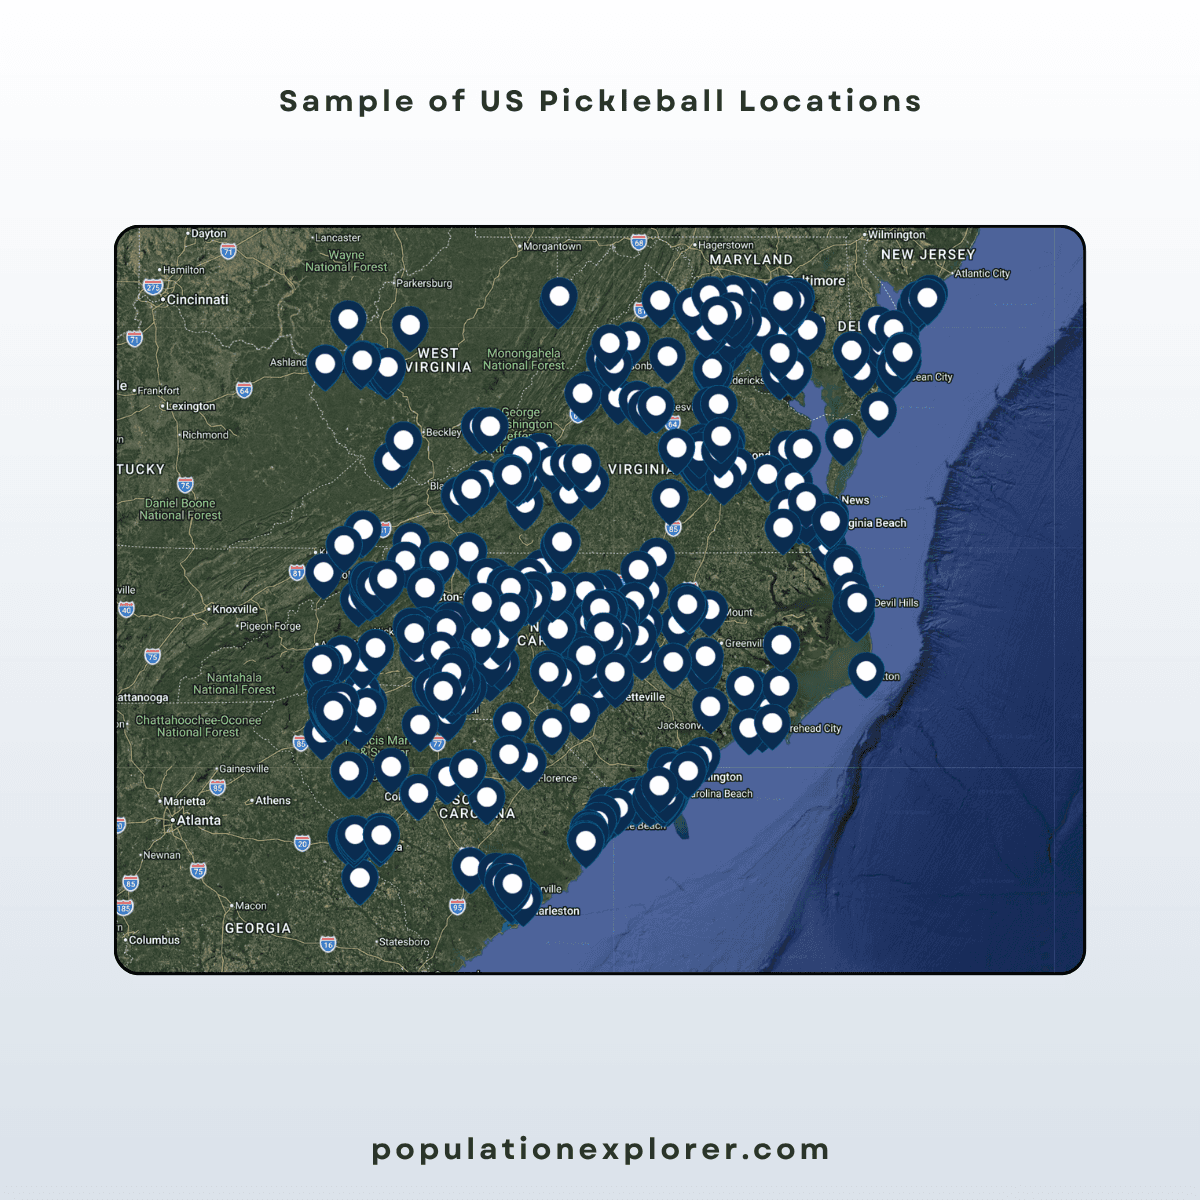
To understand the opportunity in Western Cape, we analyzed a dataset of 113 pickleball locations across the U.S. Southeast, each paired with a 15-minute drive-time catchment.
Across those locations:
Total population covered: 13.5 million
Average population per location: ~120,000
Median density: ~650–800 people/km²
This distribution reflects how pickleball infrastructure organizes in a market where coverage is already mature.
In more competitive US corridors, that ratio compresses significantly - down to ~16,000 people per location.
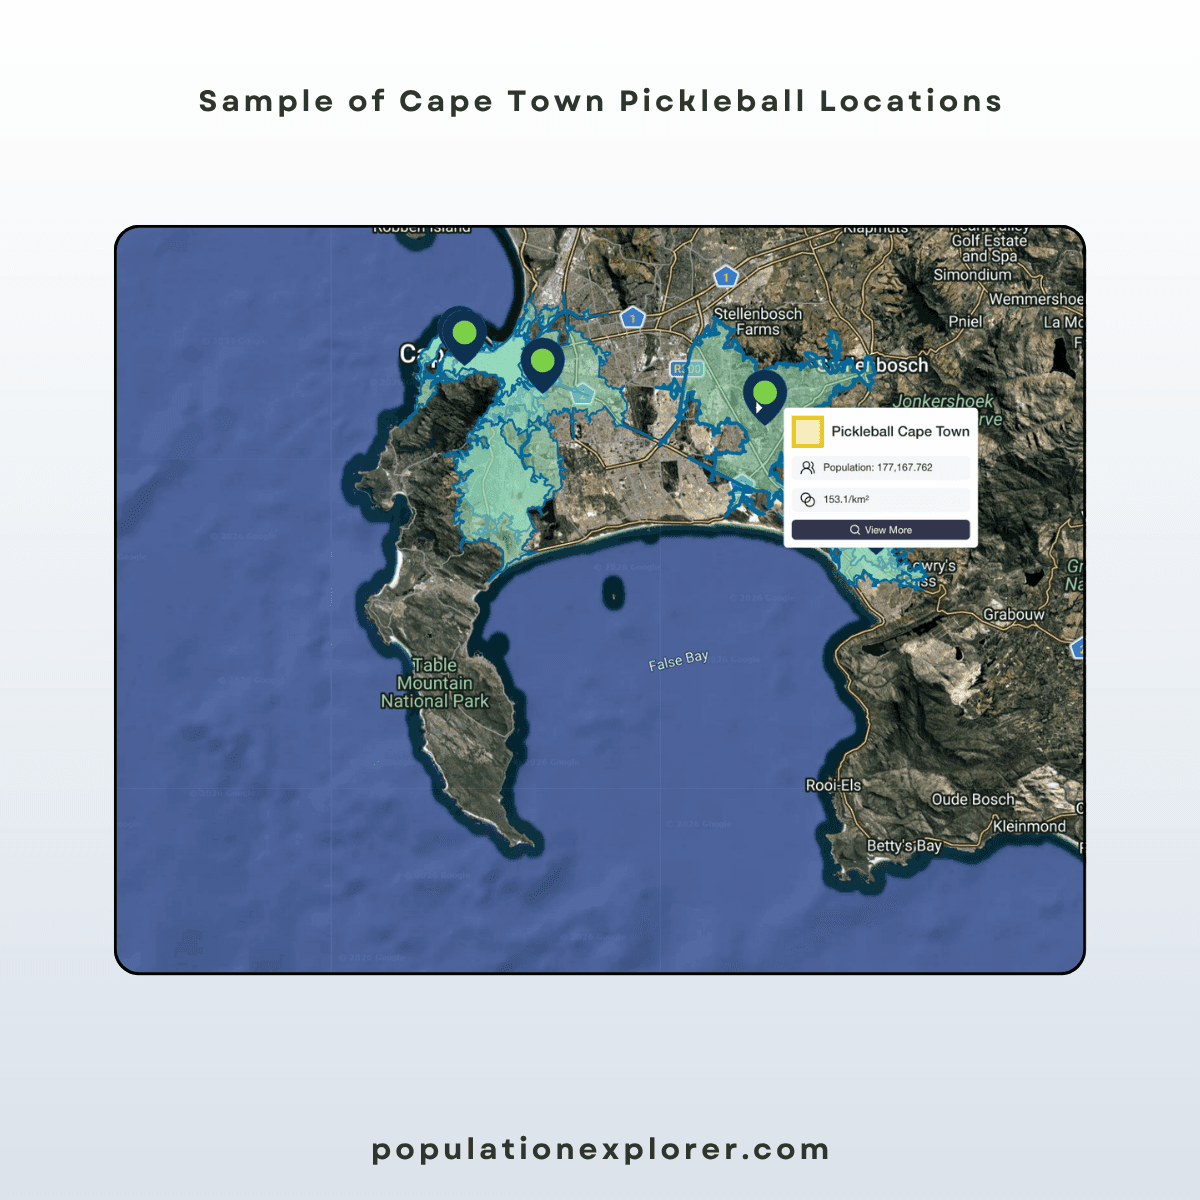
Western Cape: Population Without Coverage
Western Cape operates under a very different structure.
Total population: ~7.4 million
Identified pickleball locations: 11 (confirmed)
(~14 cited publicly depending on source)
Using 15-minute catchment analysis across the 11 mapped locations:
Combined population covered: ~2.16 million
Average population per location: ~388,000
Median population per location: ~361,000
Density: ~4,500+ people/km²
From a territory mapping standpoint, each existing location is responsible for 3x the population of a typical U.S. site.
At the provincial level, Western Cape operates at roughly 1 location per 500,000–700,000 people. Compare this to a conservative U.S. benchmark, which supports closer to 1 location per ~120,000 people.
How Many Locations Could Western Cape Support?
Using a conservative benchmark:
7.4M population ÷ 120,000 per site = ~60 total locations
Current supply:
11–14 locations
Implied gap = 45–50 additional locations
This estimate does not assume aggressive adoption. It simply applies the structure of a stable U.S. market to a comparable population base. More competitive environments suggest higher ceilings, particularly in dense urban zones, but the conservative case alone is enough to support expansion.
Why Cape Town Performs Like a Growth Market
The underlying conditions in Cape Town align closely with environments where participation-based sports expand quickly.
Established franchise environment
South Africa already supports a mature franchise economy, with hundreds of systems and tens of thousands of franchisees.
For operators, that means:
Territory-based expansion models are familiar
Multi-unit growth is a known playbook
Site rollout can follow existing commercial patterns
For pickleball, this reduces friction on the supply side.
Recreation-driven demand
Cape Town’s physical environment consistently supports participation:
Beaches, trails, and cycling infrastructure
~300 days of sunshine per year
Large-scale endurance and recreational events
From a site selection perspective, this translates into:
High baseline activity levels
Strong adoption potential for social sports
Repeat-use behavior within local catchments
International demand exposure
Cape Town receives significant inbound traffic from:
United States
United Kingdom
Germany
Netherlands
France
These are markets where pickleball adoption is relatively mature.
The implication for operators:
Customer awareness is not limited to local discovery
Visiting populations introduce familiarity and demand signals
Early locations benefit from both resident and visitor usage
Current Supply: Early Network Formation
Existing pickleball locations in Western Cape share a consistent pattern:
Courts embedded within tennis or multi-sport facilities
Limited dedicated infrastructure
Fragmented geographic coverage
From a territory mapping standpoint, the network remains incomplete:
Large population centers sit outside efficient 15-minute access
High-density zones are not fully covered
Catchments overlap inconsistently while leaving gaps elsewhere
This is typical of a market prior to structured expansion.
Implications for Site Selection and Expansion
For operators evaluating Cape Town, pickleball comprises a substantial and rare opportunity. There are multiple ways to more precisely narrow down candidate locations:
Finding optimal locations for a new site:
Identify high-density population clusters
Map existing 15-minute coverage
Prioritize zones where density exceeds U.S. benchmarks without corresponding supply
Creating a territory map for franchise expansion:
Structure territories around ~100k–150k population bands
Avoid early over-concentration in known nodes
Expand outward to establish coverage before competition emerges
The first network built with this level of discipline will define the market.
Conclusion: A Market Waiting to Be Built
Western Cape has remarkable market qualities.
A globally recognized city.
A recreation-driven population.
A steady inflow of international visitors.
And a commercial environment where multi-location expansion is already understood.
What’s missing is infrastructure.
The current pickleball footprint is small, fragmented, and unevenly distributed relative to the population it serves. The gap between demand potential and court coverage is not marginal - it is large enough to support a structured rollout of new locations under conservative assumptions.
That has two immediate implications. First, this is not a market where marginal expansion wins. A single location will not change coverage ratios. An entire network will. Second, early decisions will matter. Territory boundaries, site placement, and sequencing will shape how the market develops, and who controls it.
Want to see where the next 10 pickleball locations in Cape Town should go?
Map population density, drive-time coverage, and underserved zones in Population Explorer.
→ Go to the map
Next up:
→ Franchise territory mapping hub
→ How to measure population in a fixed radius or driving distance
→ Jakarta retail coverage analysis
Explore expert articles, eCommerce guides, and the latest updates to help your business grow smarter and sell better with Unistore.

Jun 26, 2026
The Cornfield Effect
The cornfield effect is a systematic error in demographic analysis that occurs when census data attributes population to uninhabited areas (e.g., farmland, parks, industrial zones) within a census boundary. This distortion leads to overestimates of customer density and misguided location decisions with notable, negative impacts on franchise territory design and retail site selection. Constrained population models, such as WorldPop Global 2, eliminate the cornfield effect by assigning population only to areas where human settlements have been confirmed to exist.

May 22, 2026
You Can Create a Franchise Territory in Less Than 2 Minutes
Franchise territory mapping no longer has to mean expensive consultants, complex GIS software, or weeks of setup. Modern tools let franchisors create, evaluate, and compare protected territories in minutes.

May 22, 2026
At What Point Does a Franchise Need Territory Mapping?
Not every franchise needs rigorous territory mapping on day one. But once territory decisions begin affecting franchise sales, market protection, expansion planning, and long-term network value, the stakes change quickly.
