Overview
Population Explorer (PopEx) provides a map-based workspace where every geometric element — whether a circle, polygon, line, or boundary — becomes a live analytical object. These elements, known as Items, allow you to explore how population, income, and points of interest vary across geography.
In PopEx, shapes are not static drawings. Each one dynamically computes demographic summaries from authoritative datasets like LandScan and WorldPop, combining them with income models and real-time POI context from the map search bar. The result is a seamless bridge between geospatial form and human context — helping you understand who lives here, what economic power exists here, and what activity surrounds it.
From trade areas and service zones to transportation corridors and administrative regions, shapes are the backbone of every PopEx workflow — whether in retail site selection, telecom coverage analysis, sales territory planning, or humanitarian response mapping.
Buffer (Buffered Points)
A buffer creates a circular area around a location you select. It’s ideal for proximity studies — for example, determining how many people live within a 5 km radius of a store, tower, or clinic. Buffers are often the first analytical step for estimating potential reach, and they automatically return ASB results (population, density, and income) for any defined radius.
Isochrones (Travel-Time Areas)
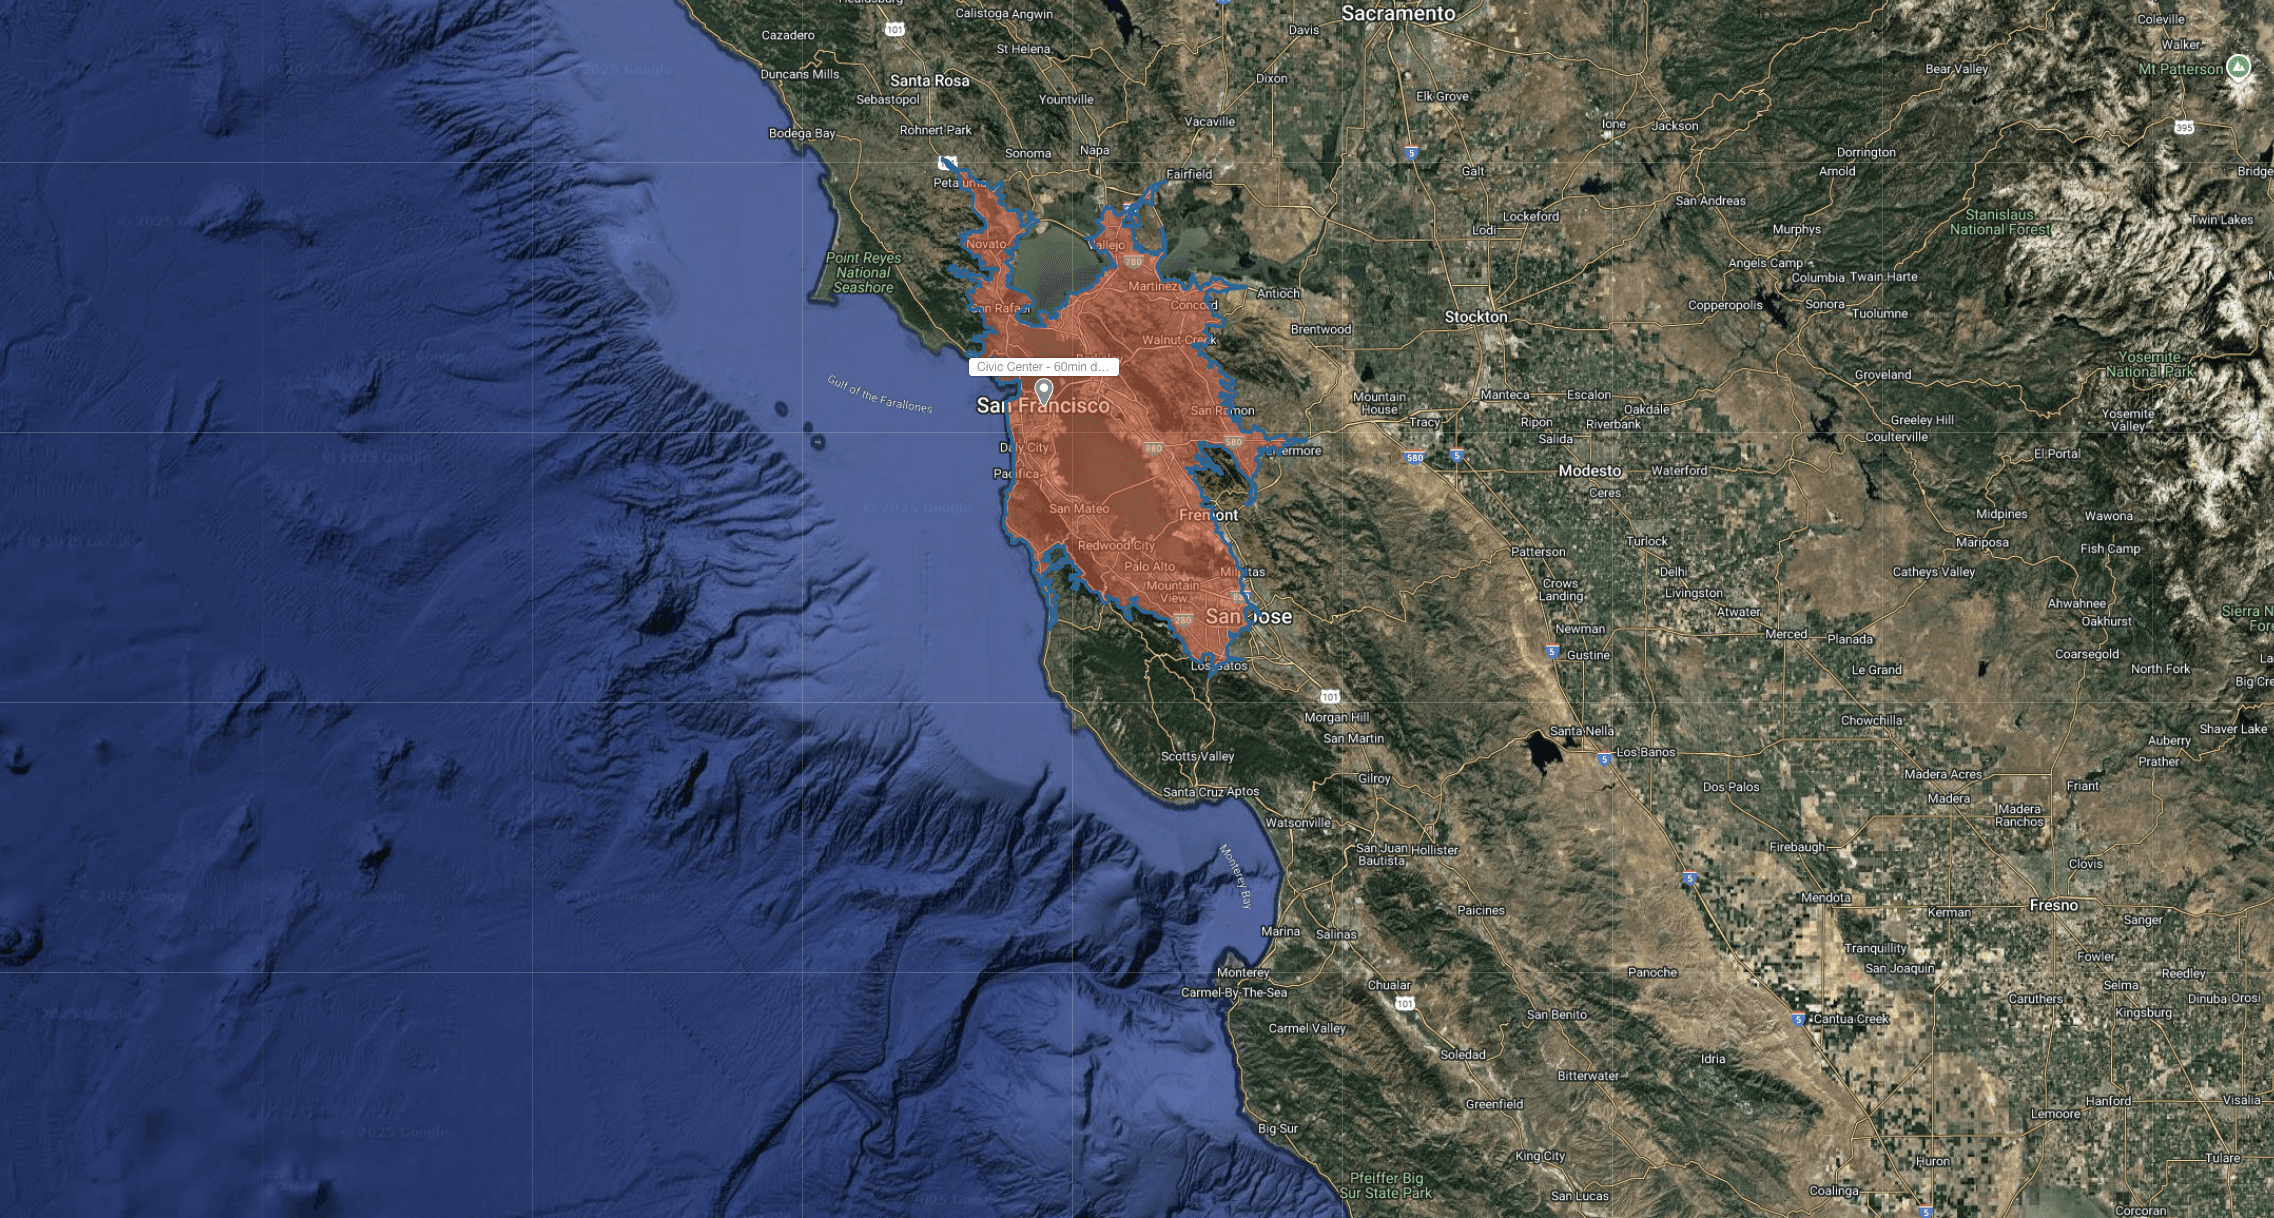
An isochrone represents how far people can travel within a certain time — a 15-minute walk, a 30-minute drive, or any other travel threshold. Unlike buffers, which measure straight-line distance, isochrones rely on network data (powered by Mapbox) to trace real-world accessibility.
Custom-Drawn Shapes
A custom shape lets you outline a unique area directly on the map — for instance, tracing an informal neighborhood, a shopping center boundary, or a catchment zone not available in standard datasets. These hand-drawn shapes behave like all other items, immediately producing ASB summaries once saved.
Line Buffers
Line buffers allow you to analyze populations along linear features — roads, pipelines, or rivers. When you draw a path, PopEx automatically creates a surrounding buffer region, quantifying population, density, and income within the chosen distance.
Markers
Markers are simple points that serve as anchors or reference locations on your map. They don’t contain demographic data themselves but can help orient analysis or mark key sites — such as schools, hospitals, towers, or field offices.
Administrative Boundaries
Administrative boundaries let you import official regions — such as counties, districts, or provinces — directly from PopEx’s built-in boundary library. These regions provide a consistent framework for comparing metrics across standard reporting units and are frequently used in public sector, NGO, and franchise-level analyses.
Shapes from Upload
You can also upload your own KML or KMZ files to bring in custom boundaries or regions created elsewhere. Uploaded shapes behave just like native PopEx items — automatically generating population, density, and income summaries.
Choosing the Right Tool
Shape Type | Primary Use | Typical Question |
|---|---|---|
Buffer | Proximity analysis | Who lives near this point? |
Isochrone | Travel-time accessibility | Who can reach this location within X minutes? |
Custom Shape | Ad-hoc regional tracing | Can I define my own area of interest? |
Line Buffer | Corridor studies | What population lives along this route? |
Administrative Boundary | Standard reporting regions | What are the demographics by county or district? |
Uploaded Shape | Imported polygons | Can I analyze my organization’s existing regions? |
Next Steps
Once you’ve created or imported your shape:
Review its ASB summary for population, density, and income.
Use the map search bar to explore nearby POIs for context.
Export your results via Export → Excel (tabular) or Export → KML (spatial).
To learn more, explore related guides:
Need More Help?
If you run into issues, please contact us.