Get oriented with Population Explorer — the platform that unites population, POIs, and income data for decision-making across industries.
The Platform at a Glance
Population Explorer (PopEx) is a spatial decision platform designed to help you understand where people are, what surrounds them, and what they can afford. Whether you’re expanding a retail network, balancing sales territories, optimizing telecom coverage, or coordinating humanitarian response, PopEx provides a unified map-based workspace for connecting population, points of interest (POIs), and purchasing power.
At its core, PopEx brings together three critical dimensions of spatial intelligence:
Population — where people live and in what density.
POIs (Points of Interest) — where businesses, services, and competitors operate.
Earning Power — how much disposable income exists within those areas.
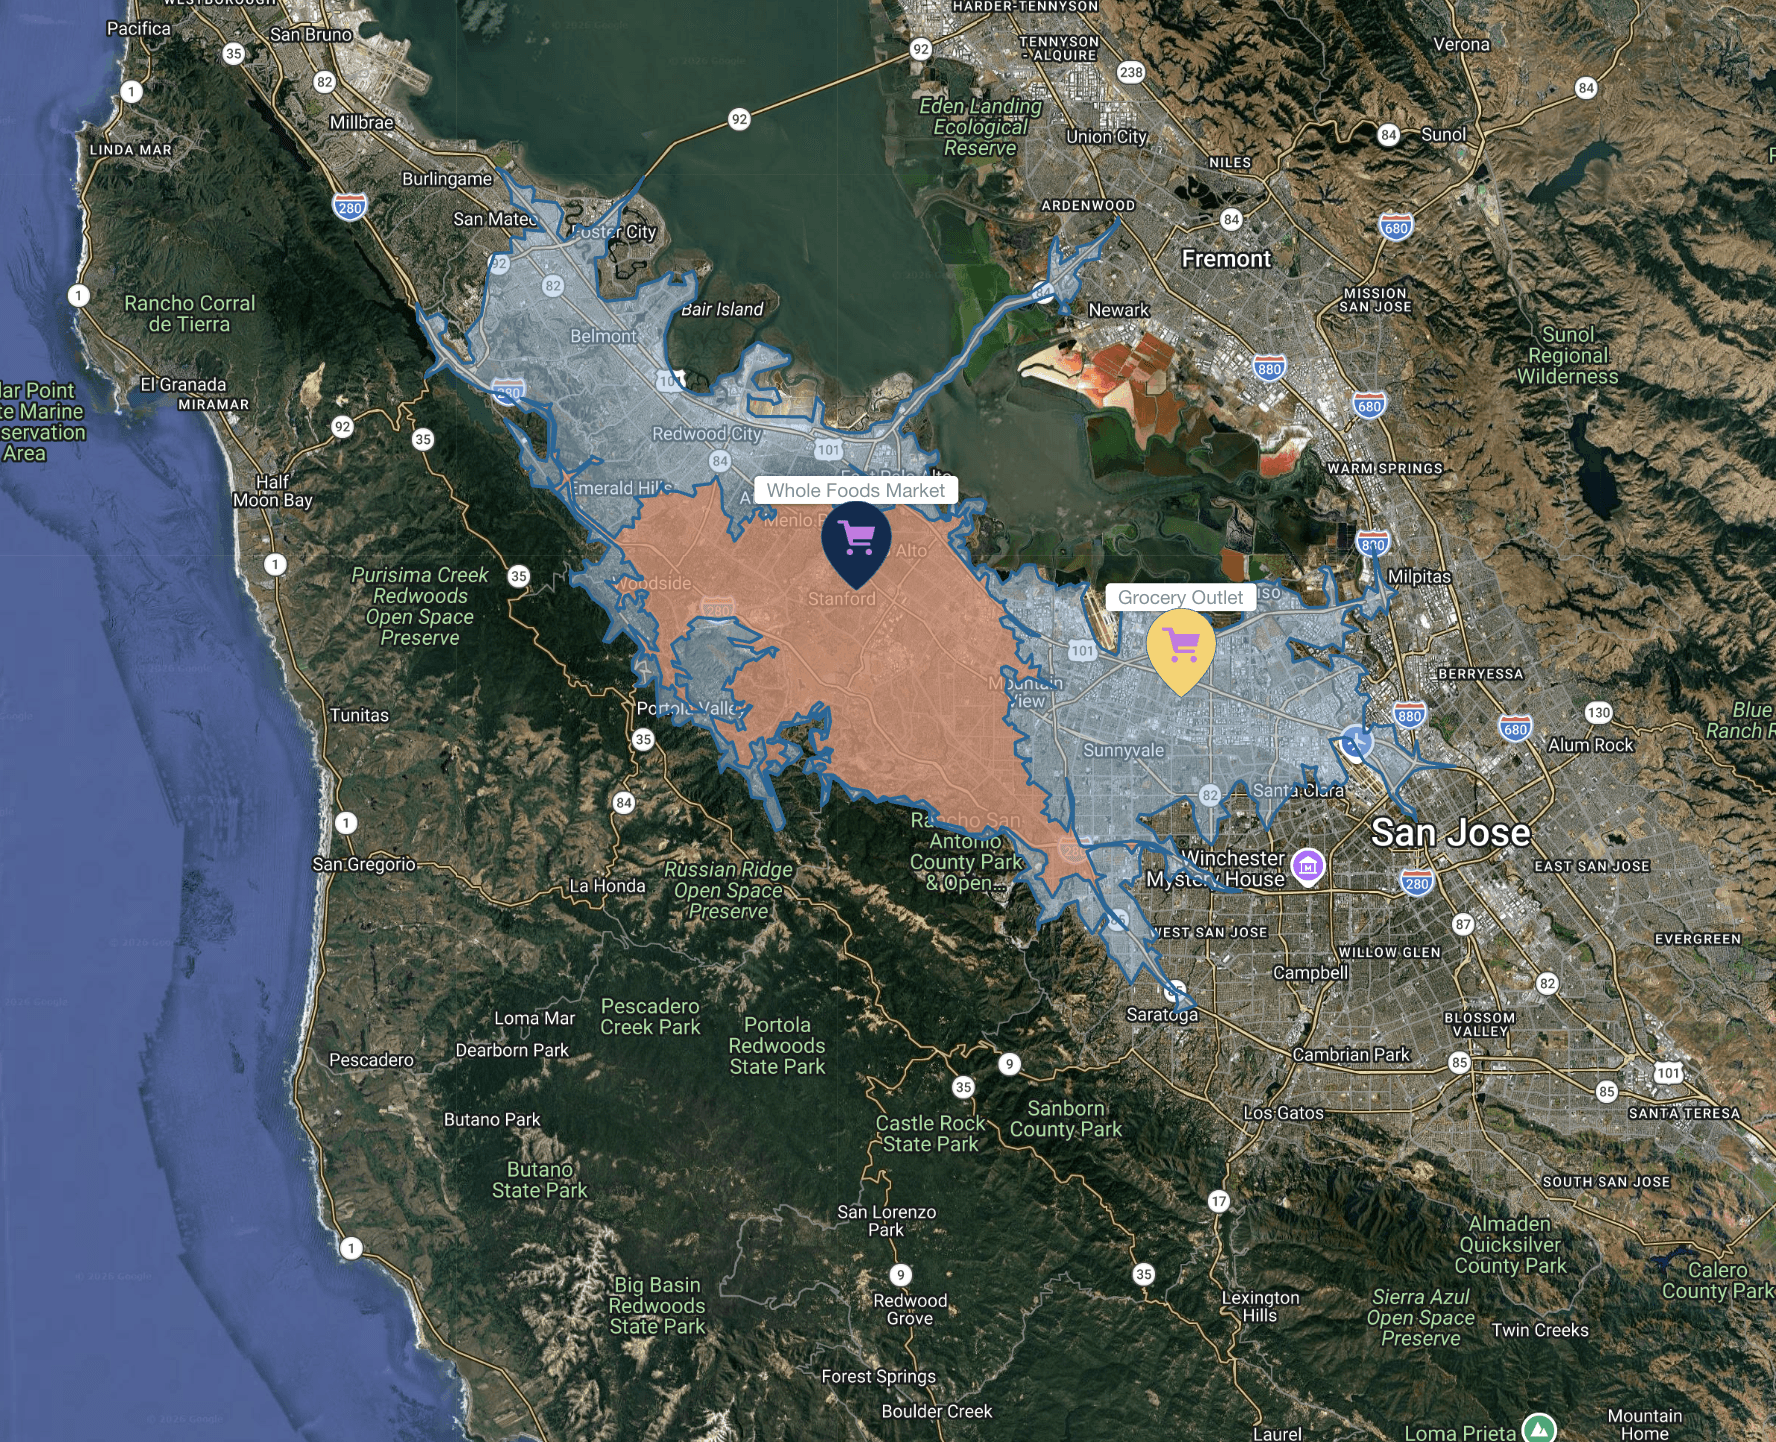
Every analysis begins by defining a geography — a city, a trade area, a drive-time zone, or a custom boundary. PopEx then calculates and visualizes how these three factors intersect. Within seconds, you can see not just how many people live nearby, but what their income potential is and what the competitive or service landscape looks like around them.
All this is powered by globally standardized, high-resolution data: LandScan and WorldPop population grids, income and demographic models, and live or cached Google POI integrations. Together, they provide a coherent spatial framework that can be applied consistently from one city to another — anywhere in the world.
A Platform Built for Real Workflows
Retail & Franchise Site Selection — visualize where potential customers live, where competitors are located, and how income levels vary across trade areas.
Franchise and Sales Territory Mapping — balance territories by population, earning power, or existing account locations.
Telecom Site Mapping — measure population within coverage zones and identify service demand centers through POIs.
Humanitarian & Disaster Response — estimate affected populations and assess accessibility and vulnerability.
The PopEx Interface at a Glance
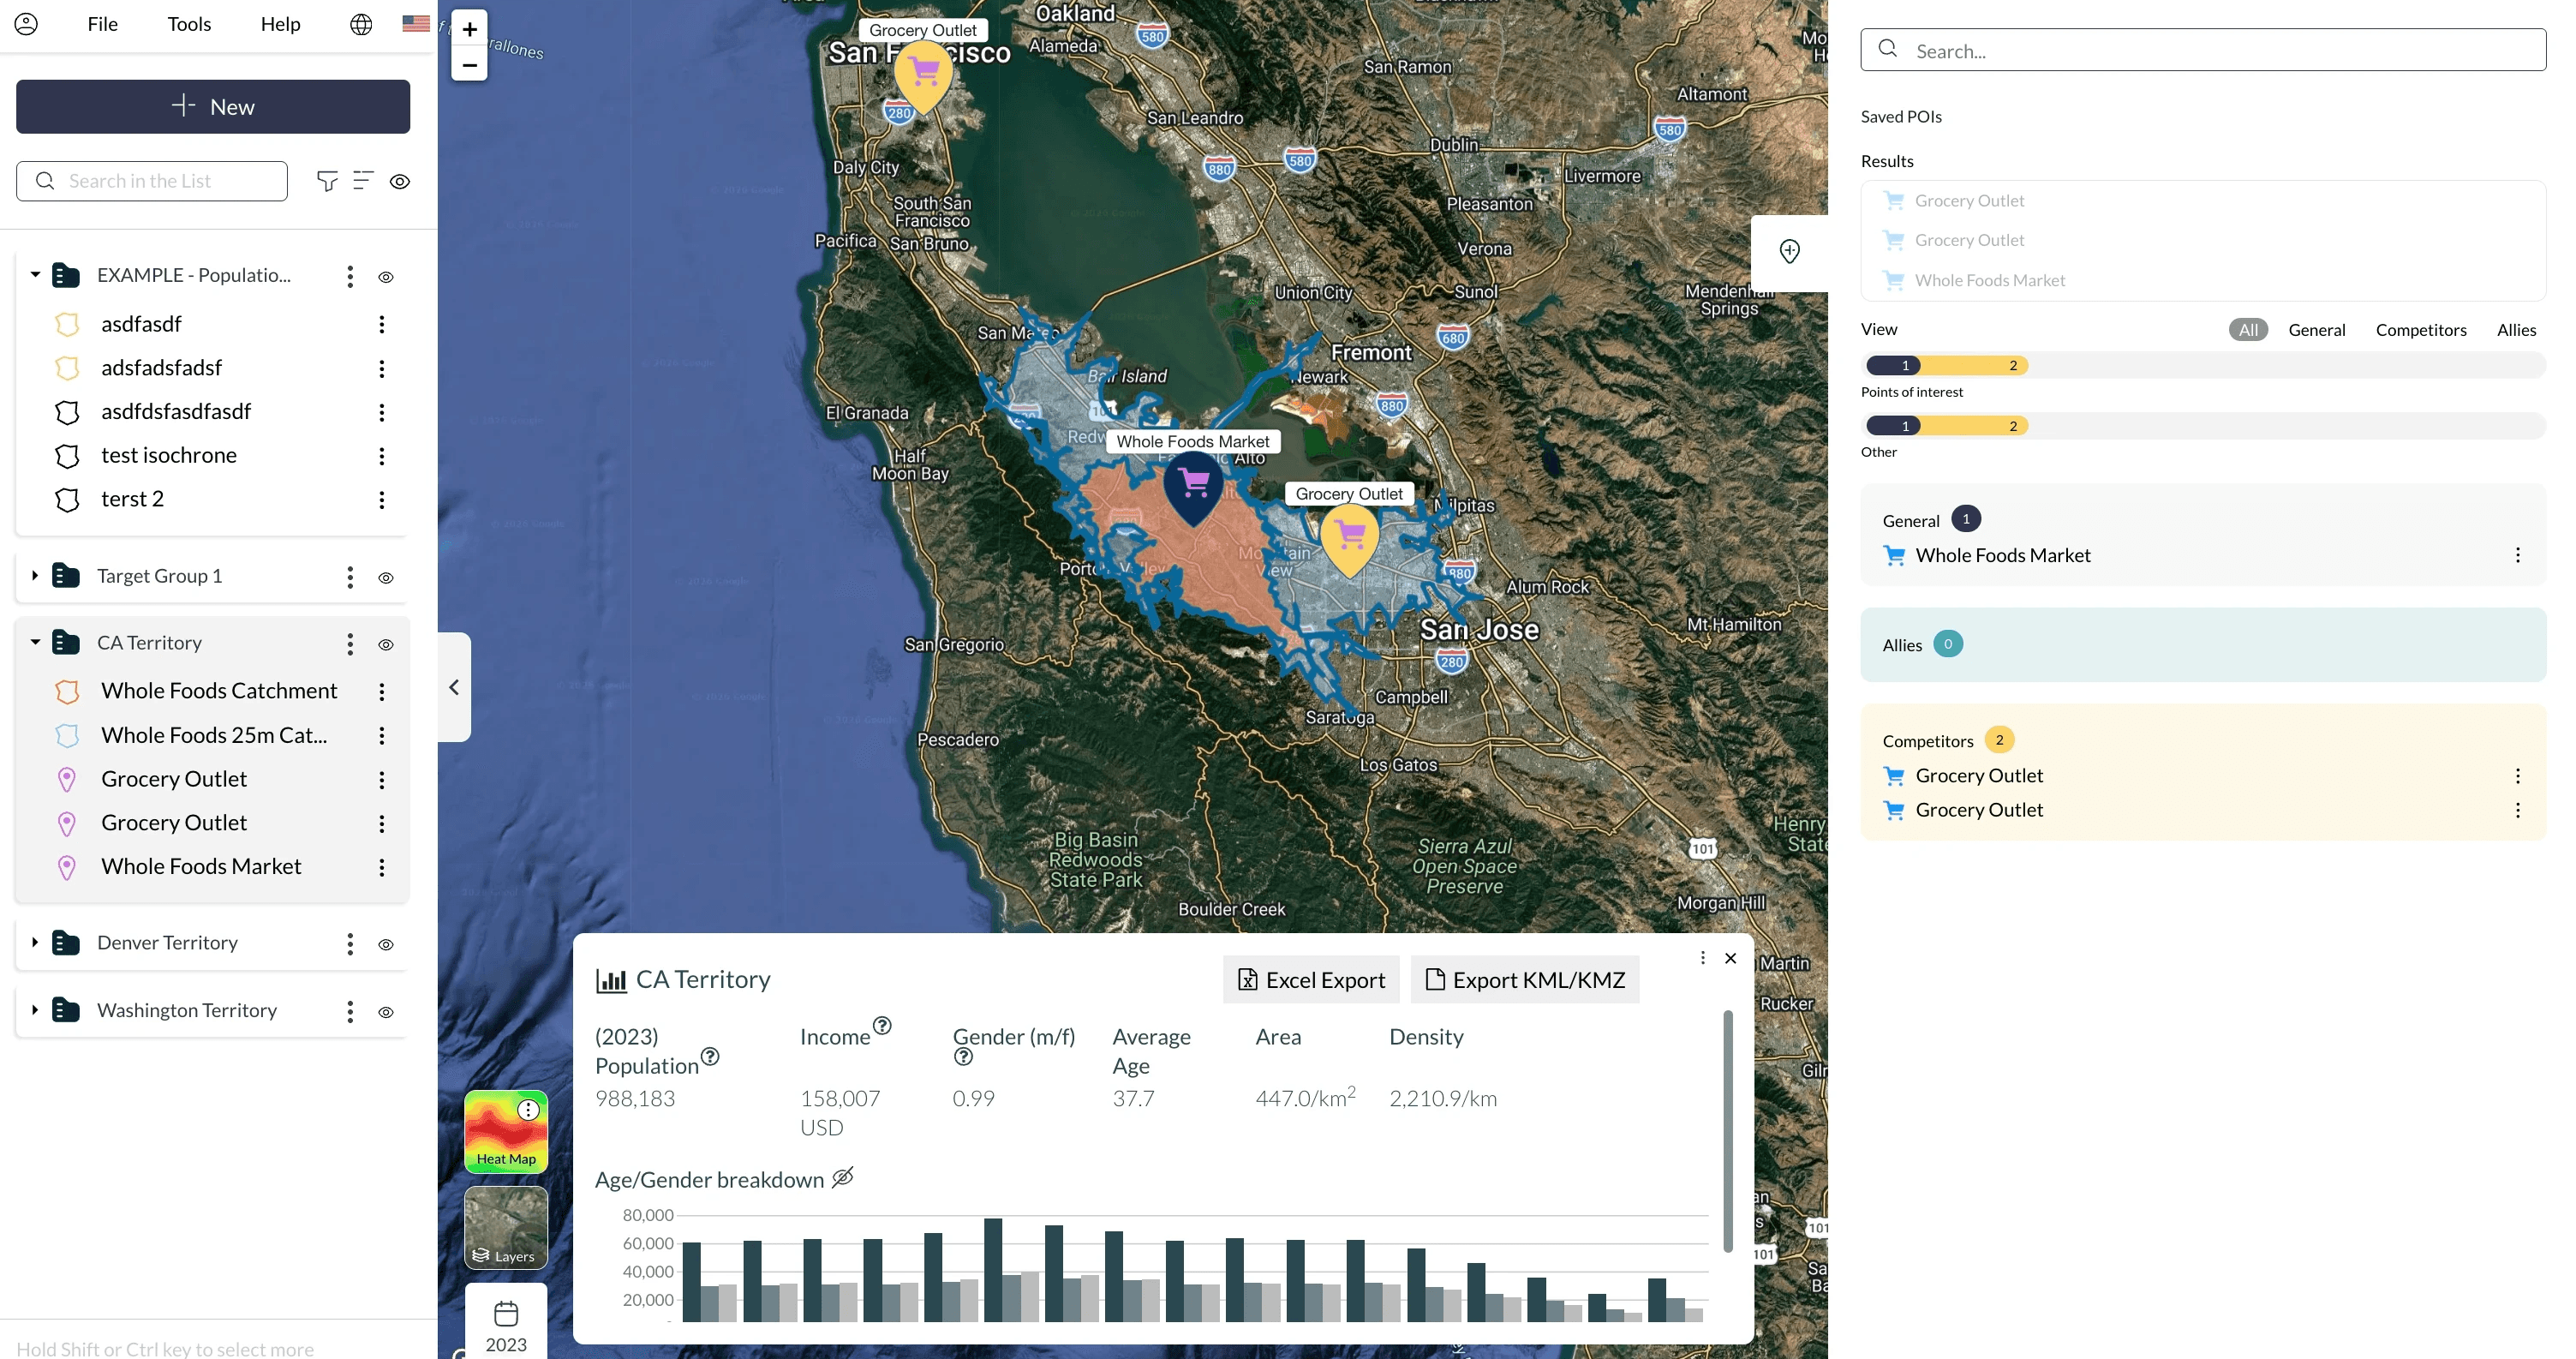
Left Drawer - organize projects into Folders and Items.
Top Toolbar - create shapes and folders, import territories and POIs, search/sort/filter existing shapes.
Map Canvas - visualize population density, income gradients, and POI distribution together.
Summary Panel - view ASB results: total population, density, and income for any selected area.
POI toolset (Right Drawer) - search Google's global POI database for competitors and allies, temp save to territory folders.
Export Tools - export your analyses to Excel or KML for external modeling or sharing.
Prefer videos? Watch the application overview here.
Why These Three Layers Matter
Dimension | What It Tells You | Why It Matters |
|---|---|---|
Population | How many people live within an area | Defines demand and service load |
POIs (Points of Interest) | What businesses, services, or infrastructure are present | Reveals competition, amenities, or access points |
Earning Power | What residents can afford based on income modeling | Determines viability, spending potential, and equity gaps |
What Makes PopEx Different
PopEx doesn’t ask you to be a GIS expert. Instead, it wraps authoritative datasets, geospatial processing, and economic modeling into a streamlined, accessible interface. You can visualize and quantify opportunity in minutes — from anywhere in the world — without complex configuration or code.
Because all data is globally harmonized, a planner working in Nairobi and a franchise analyst working in Houston are using the same models, at the same scale, with the same metrics. That consistency makes PopEx the bridge between local decision-making and global comparability.
Further Reading
Need More Help?
If you run into issues, please contact us.
Explore our latest thinking on franchise territory design, retail site selection, and the population data that powers smarter location decisions.

Jun 26, 2026
The Cornfield Effect
The cornfield effect is a systematic error in demographic analysis that occurs when census data attributes population to uninhabited areas (e.g., farmland, parks, industrial zones) within a census boundary. This distortion leads to overestimates of customer density and misguided location decisions with notable, negative impacts on franchise territory design and retail site selection. Constrained population models, such as WorldPop Global 2, eliminate the cornfield effect by assigning population only to areas where human settlements have been confirmed to exist.

May 22, 2026
You Can Create a Franchise Territory in Less Than 2 Minutes
Franchise territory mapping no longer has to mean expensive consultants, complex GIS software, or weeks of setup. Modern tools let franchisors create, evaluate, and compare protected territories in minutes.

May 22, 2026
At What Point Does a Franchise Need Territory Mapping?
Not every franchise needs rigorous territory mapping on day one. But once territory decisions begin affecting franchise sales, market protection, expansion planning, and long-term network value, the stakes change quickly.
