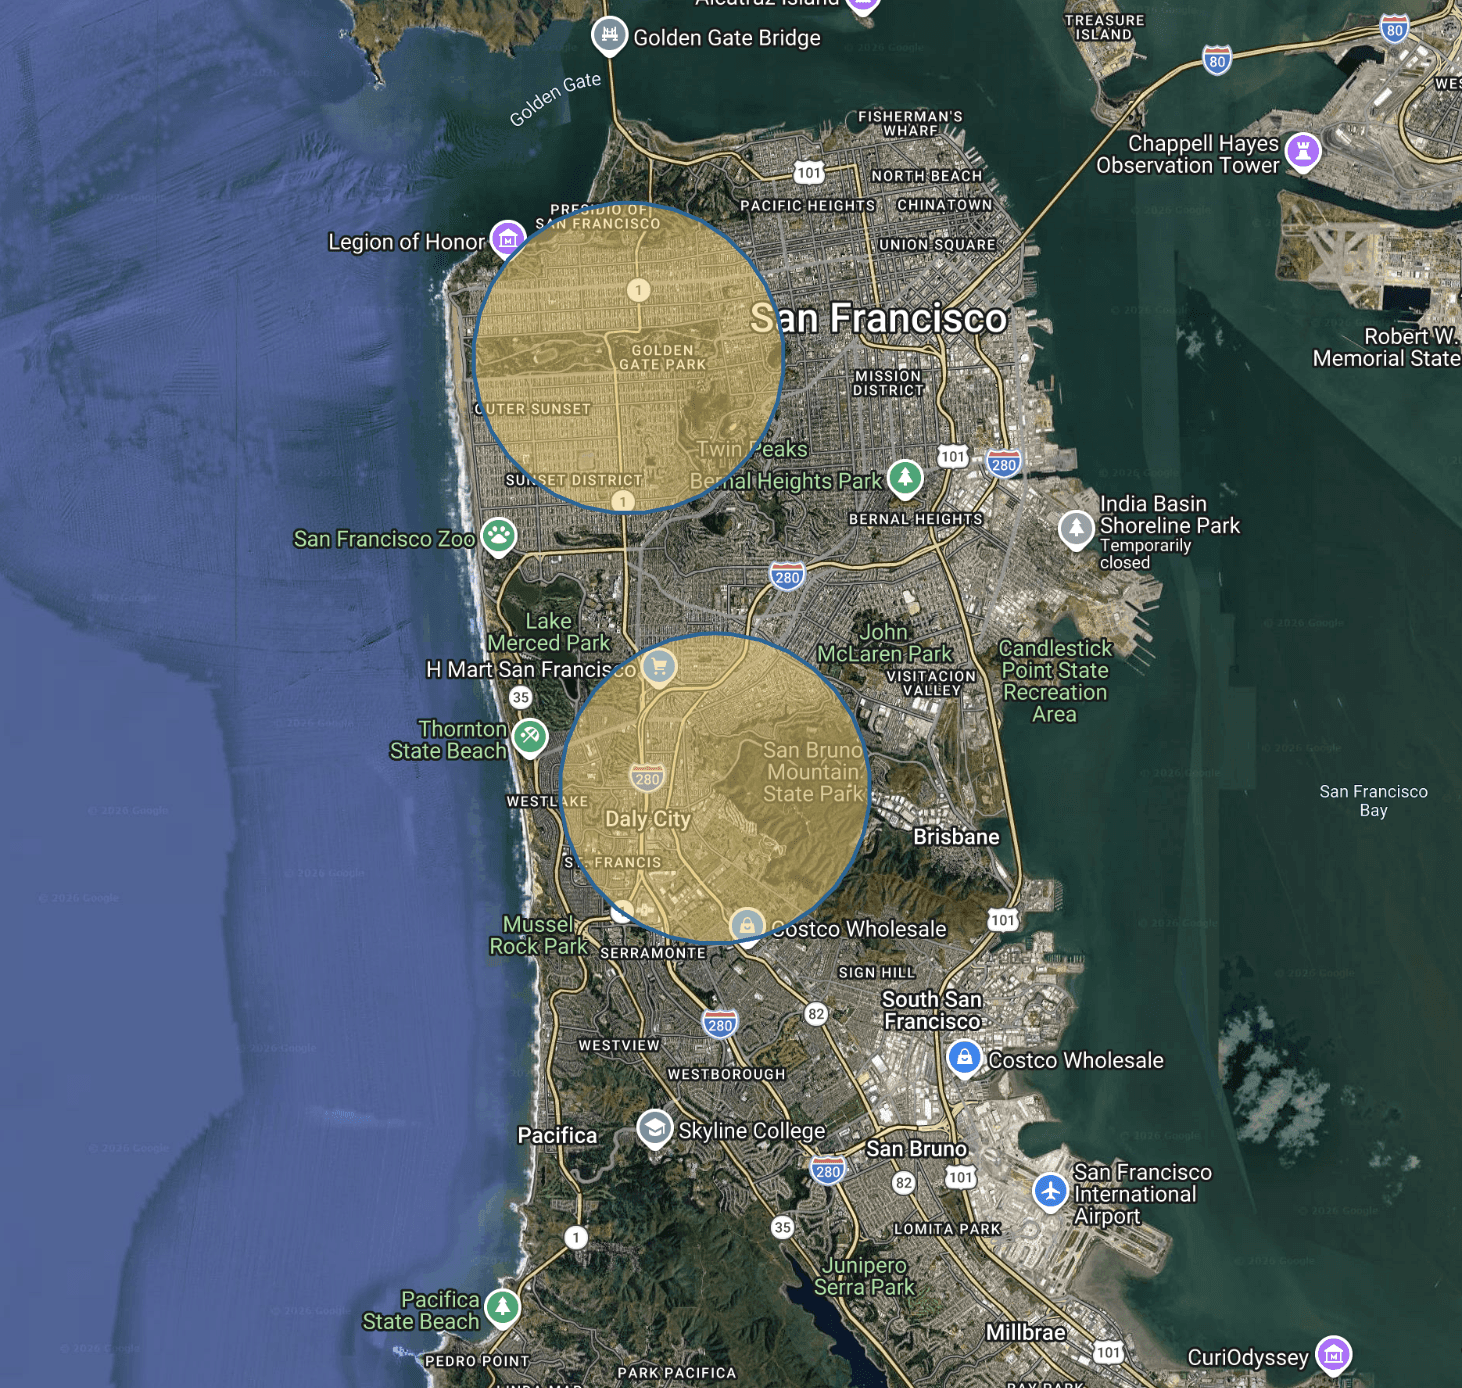
Learn how to create drive-time territories and radius buffers for multiple locations at once. Use bulk territory creation to analyze network coverage, identify whitespace opportunities, and compare site performance across markets.
What This Feature Does
The bulk territory tool allows you to create drive-time or radius-based territories for multiple locations at once.
Instead of building territories one by one, you can generate boundaries for entire sets of locations—whether they were:
Imported
Manually created
Saved from POI searches
This function underpins two core site selection and territory planning workflows: whitespace analysis and network coverage analysis.
Whitespace analysis identifies areas with population but limited competitive coverage -providing a starting point for selecting new retail sites or defining new franchise territories.
Network coverage analysis reveals where existing locations fall short of reaching target populations, helping identify gaps in coverage and opportunities to strengthen a network.
How Bulk Territory Creation Works
Bulk territory creation operates at the folder level.
Any POIs saved in a folder - whether categorized as General, Competitor, or Ally - can be used to generate territories in a single action.
This is the first step for both network coverage and whitespace analysis: start by saving all relevant locations into a folder.
For network coverage analysis, these POIs represent your:
Current locations
Planned or candidate locations
You can add these locations by:
Manually placing markers on the map
(Pro users can import unlimited POIs.)
For whitespace analysis, these POIs typically represent:
Competitor locations within your market
Best Practice: Organize by Use Case
We recommend using separate folders for each type of analysis.
Most users will run both workflows: it’s critical to both understand competitive coverage and whether your locations have adequately reached your target demographic. Keeping them in separate folders makes analysis and visualization significantly easier:
One folder for your network locations
One folder for competitor locations
This allows you to quickly switch between coverage and whitespace views without mixing data.
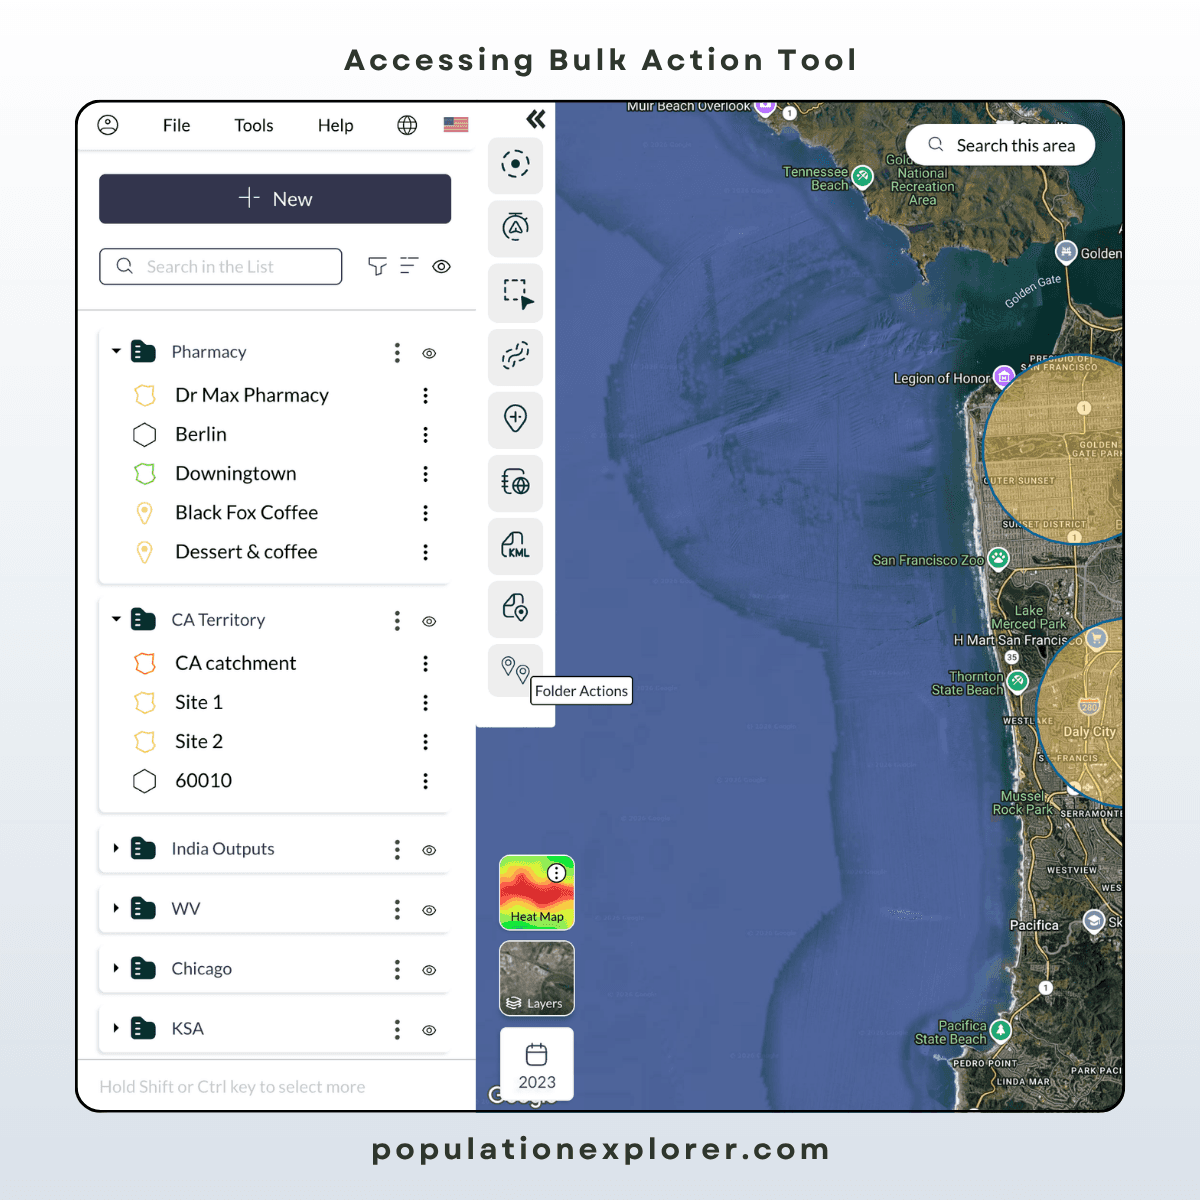
How to Access the Bulk Territory Tool
Click the “New” button
Select “Create new item”
In the menu, locate the final option (two GPS icons) — this is the bulk action tool
Select this option to open the bulk territory menu
Choosing a Territory Type
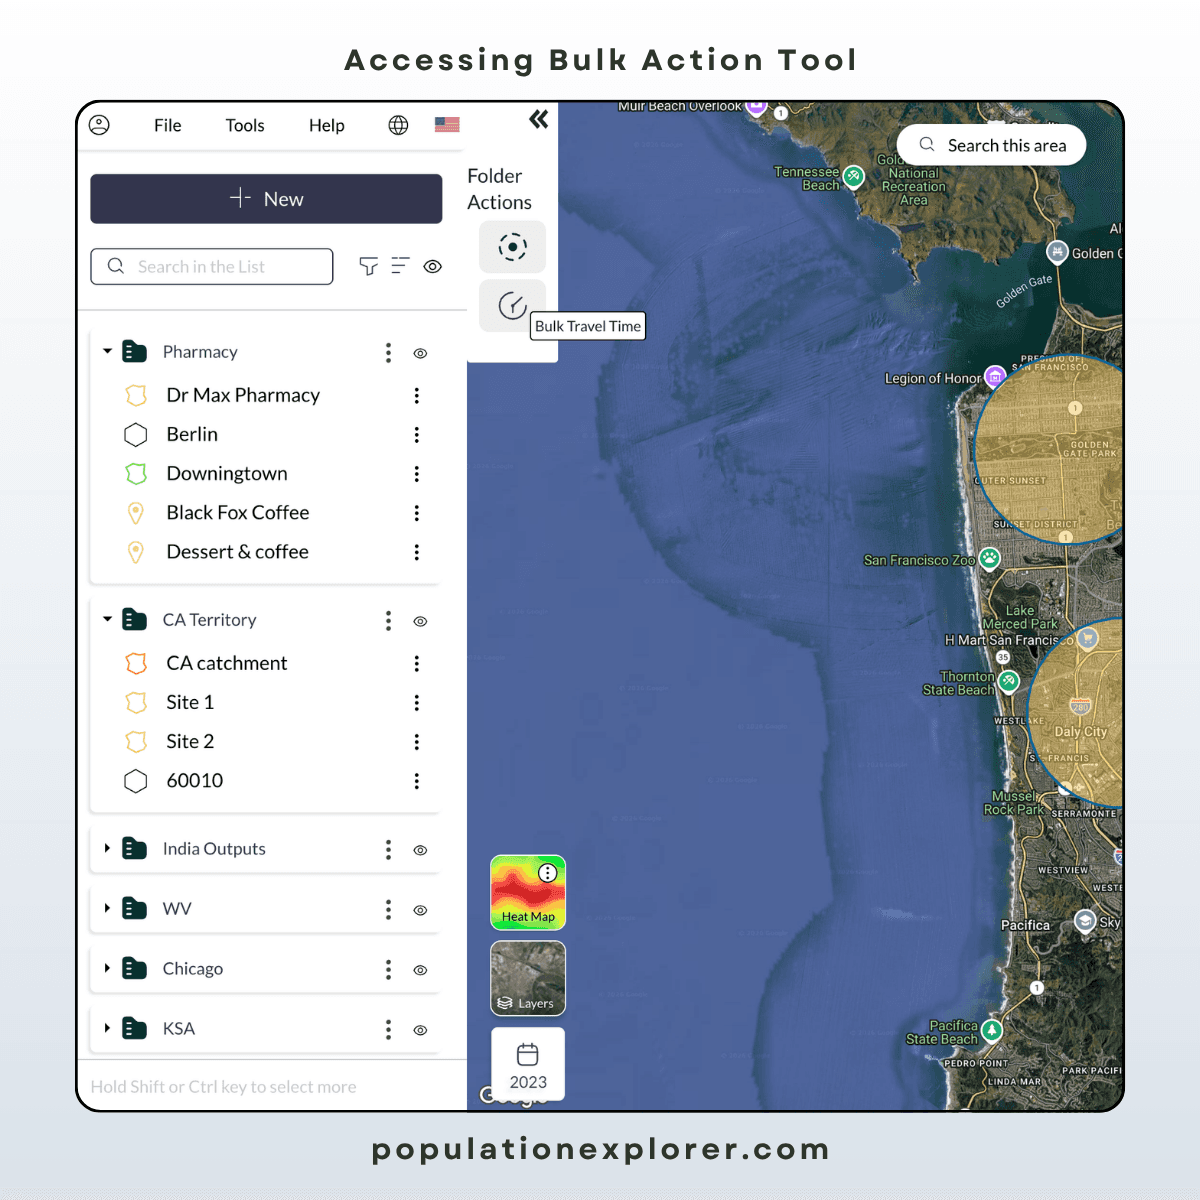
After opening the bulk tool, you’ll see two options:
Radius (Buffer) → fixed-distance territories
Isochrone (Clock Icon) → drive-time or travel-time territories
Creating Radius (Buffer) Territories
Select the radius (buffer) option
Enter a distance in kilometers
Click Add
This will create a buffer around every location in the selected folder.
Each buffer represents a fixed geographic reach from that location.
Creating Isochrone (Drive-Time) Territories
Select the isochrone (clock icon) option
Choose a transport mode:
Walking
Cycling
Driving
Driving in traffic
Enter a time value (in minutes)
Click Add
This will create a travel-time boundary around each location, reflecting how far a customer can realistically travel.
What Happens After Creation
Once created:
Each territory appears as an individual shape on the map
All shapes are tied to the original folder of locations
Each territory behaves like any other shape in PopEx
This means you can immediately:
View population and income metrics
Compare territories side-by-side
Use them in further analysis
How Bulk Territories Enable Analysis
Beyond simply measuring population across multiple locations, bulk territory assignment enables deeper comparative analysis—making it possible to evaluate coverage, identify gaps, and forecast performance across an entire network.
Network Coverage Analysis
Generate territories for all your locations, then enable the population density heat map to visualize:
Where coverage overlaps — areas at risk for cannibalization
Where gaps exist — areas that may require additional locations
This provides a clear view of how effectively your current network reaches your target population.
Read our network coverage analysis of Jersey Mike’s (a master class in network coverage).
Whitespace Identification
Generate territories for all competitor locations, then enable the population density heat map to identify areas where:
Population exists
But no competitor territories reach
These areas often represent strong expansion opportunities, particularly when population density is high and coverage is limited.
From Coverage to Decision-Making
Bulk territory creation allows you to move from raw location data to a clear understanding of market structure.
Once you’ve identified:
Where your network reaches (coverage)
Where competitors operate (whitespace and pressure)
You can begin evaluating which locations are actually worth pursuing.
At this stage, the goal shifts from mapping → comparison and prioritization.
Comparing Candidate Locations
After narrowing your map to a smaller set of candidate locations, you can evaluate each territory more precisely by focusing on three core factors:
Customer base — how much population exists within reach
Competition — how many competitors are serving that population
Economic strength — how strong the underlying market is
Together, these comprise three fundamental factors in predicting and selecting successful retail locations or franchise territories.
Where This Fits in Your Workflow
Bulk territory creation is typically the bridge between:
Exploration (finding locations, mapping competitors)
Evaluation (comparing territories and forecasting performance)
It allows you to move quickly from:
“Where are the locations?”
to
“Which of these actually works?”
Explore our latest thinking on franchise territory design, retail site selection, and the population data that powers smarter location decisions.

Aug 7, 2026
Daytime Differential: What It Is, and Why Your Retail Site Selection Strategy Needs It
What is Daytime Differential? The ratio of ambient to residential population for a site, and why site selection needs both types of data to make informed decisions.

Aug 7, 2026
Daytime Population of Europe's Million-Plus Cities, Ranked (2026)
Daytime vs. residential population, ranked across Europe's 43 million-plus cities. Some nearly double during the day; others barely hold half.

Jul 27, 2026
UK Postcode Districts Ranked by Ambient Population: Growth Leaders and Decliners (2016–2024)
This report ranks UK postcode districts by ambient population using LandScan data covering 2016 to 2024. Ambient population measures where people actually concentrate throughout the day, across employment, commuting, retail, logistics, and commercial activity, rather than simply where they sleep at night.