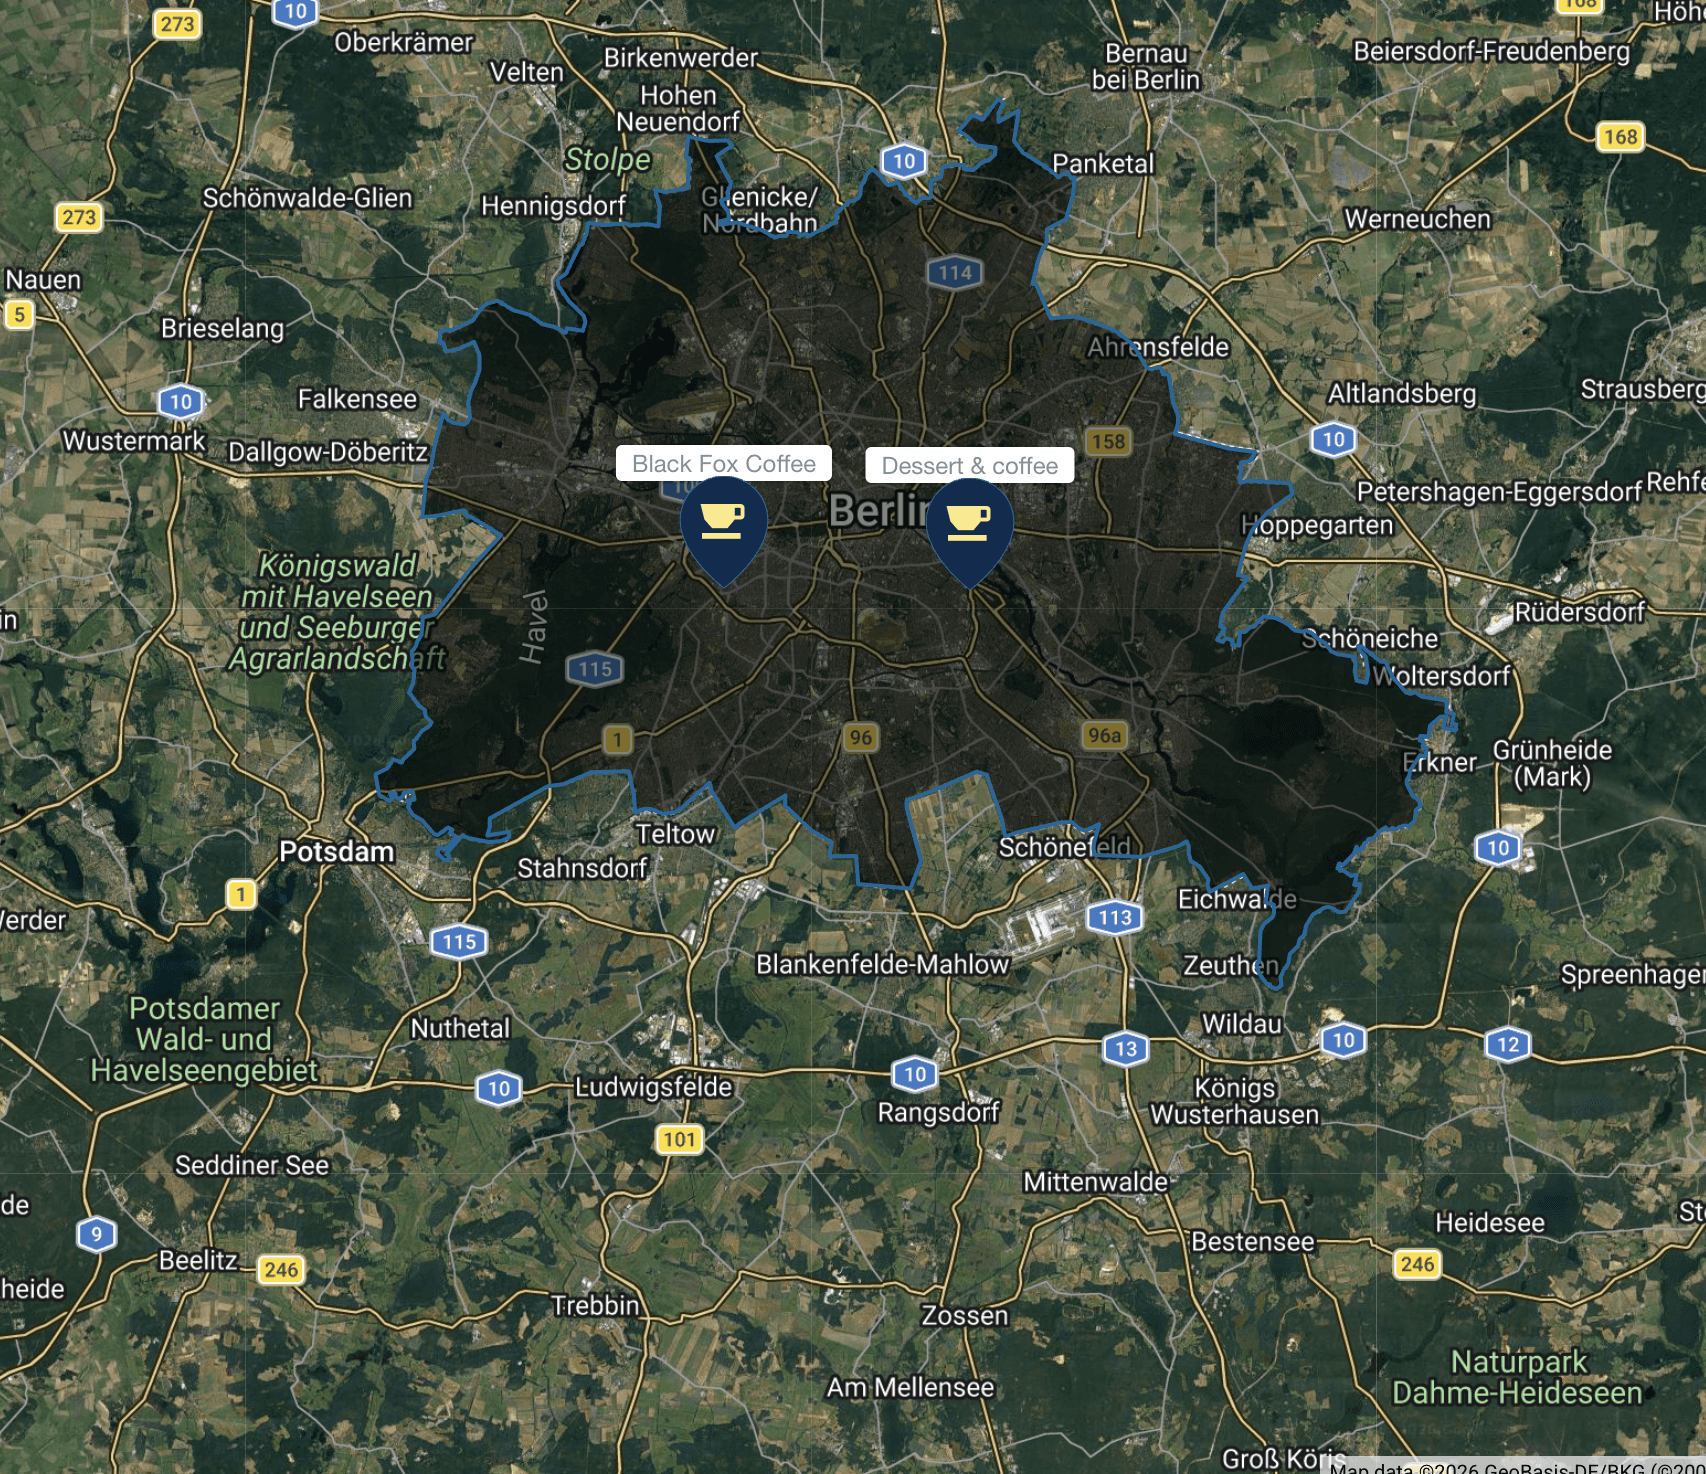
Learn how to search for points of interest, categorize locations as competitors or allies, and save them for territory analysis. This guide shows how to use POIs to evaluate market competition and identify stronger locations.
What This Feature Does
The Points of Interest (POI) search tool allows you to find real-world businesses and locations directly on the map. You can categorize these locations as competitors, allies, or general points, and save them into folders for further analysis.
Franchisors, retailers, and marketing firms need to understand competitor and ally density within trade areas to evaluate territory quality. Areas with relatively fewer competitors and more allies tend to be more attractive—and more valuable—while areas with higher competition and fewer complementary businesses are typically more constrained and harder to grow.
What are competitors and allies?
Competitors are any businesses or locations that compete for the same customers. This includes:
Direct competitors in the market
Your own locations (often referred to as cannibalization)
Allies are complementary businesses that attract your target customers without competing for their spend. For example, fitness centers often benefit from nearby health food stores or athletic apparel retailers, which draw similar audiences.
What are “General” POIs?
General POIs are locations that are relevant to your analysis but do not fall into competitor or ally categories. These might include:
Potential build-out or expansion sites
Infrastructure locations
Landmarks or other points of interest within a territory
These three elements form the foundation of competitor density and ally density - one of the core dimensions used to forecast retail site and franchise territory performance.
How to Open the POI Search Tool
You can access POI search in two ways:
Option 1: POI Icon
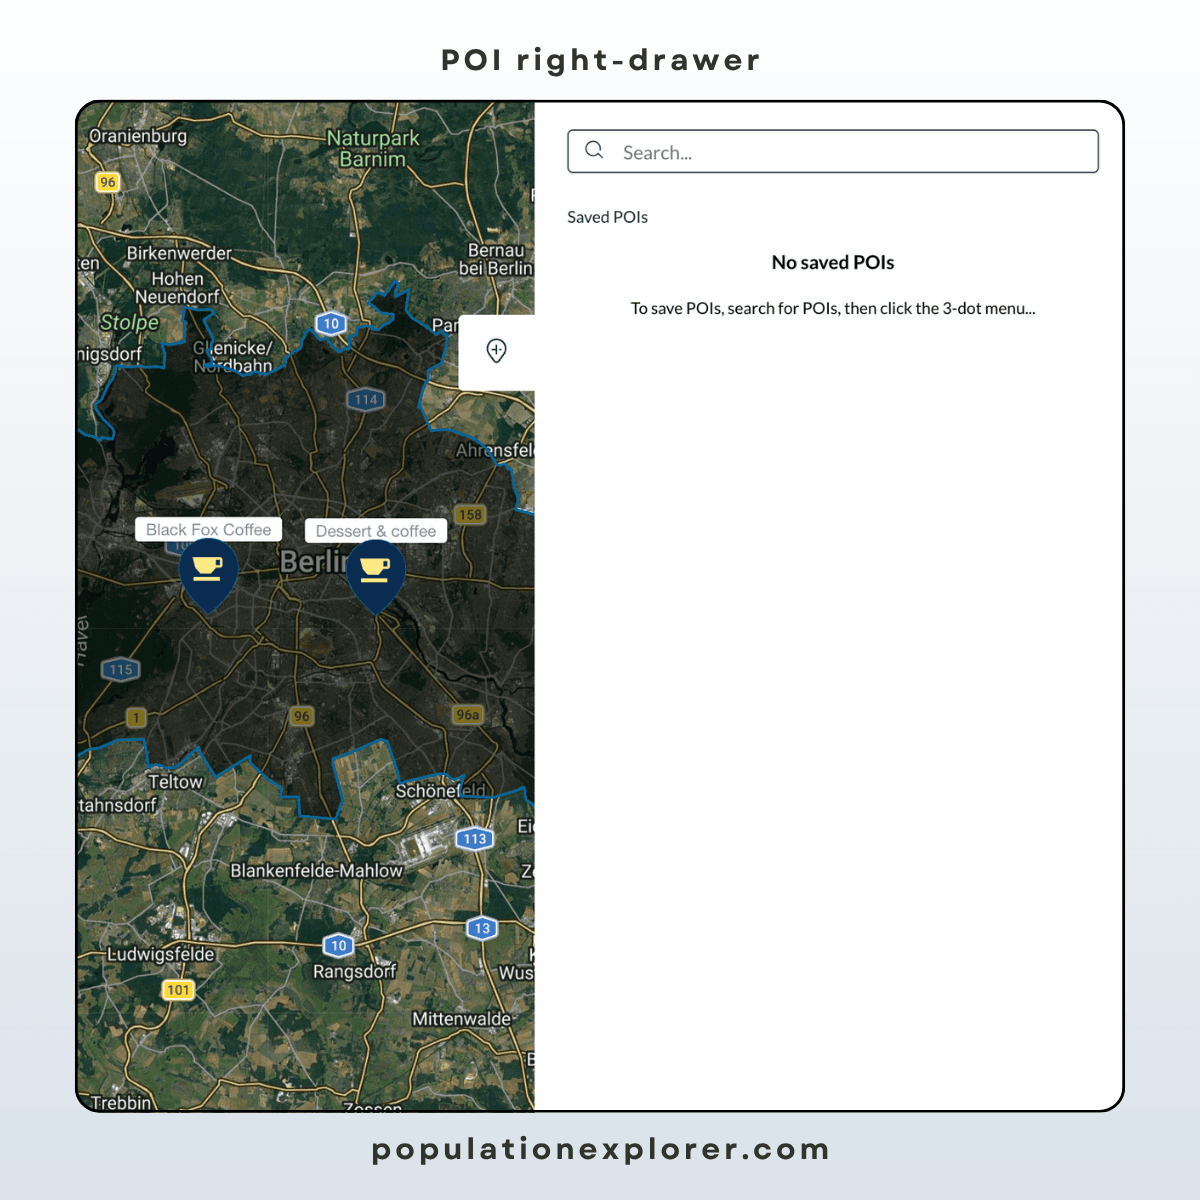
Located in the right-side drawer (collapsed by default)
Click the marker icon to open the POI panel
Option 2: Search Bar
Click the search bar in the upper-right corner of the map
This automatically opens the POI functionality
How to Run a POI Search
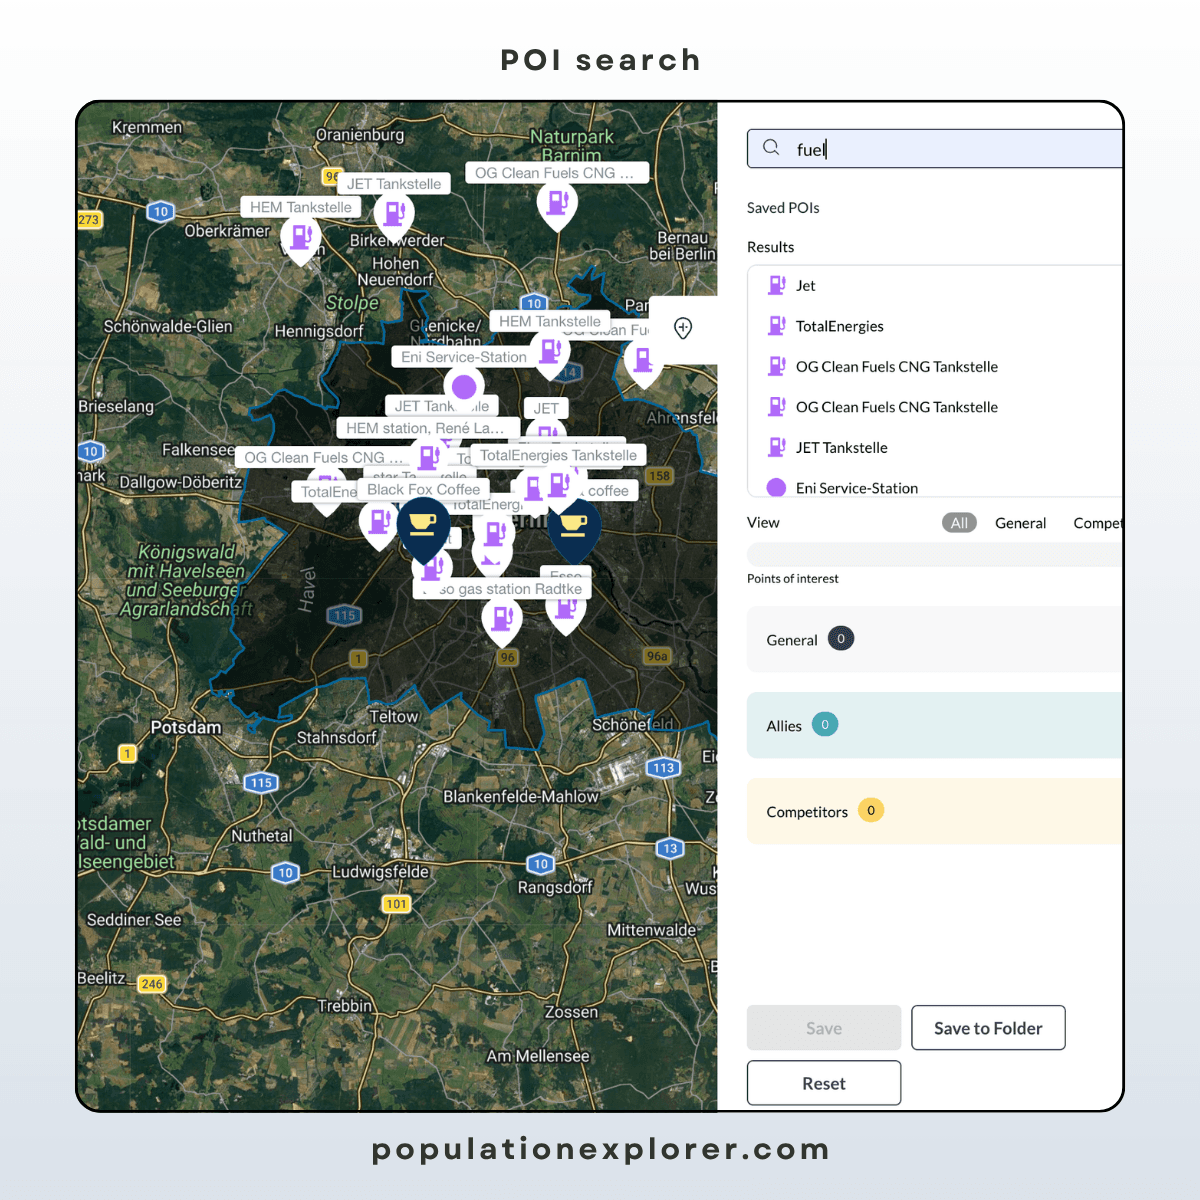
Enter a search term in the search bar
Press enter to execute the search
Search terms can include:
General categories (e.g., “restaurants”, “gyms”, “coffee shops”)
Specific businesses or locations (e.g., brand names or addresses)
Search results are powered by Google POI data and are based on your current map view.
How Results Are Determined (Zoom and Map Behavior)
Each search returns up to 20 locations, based on your current map extent and zoom level.
When zoomed out, results are spread across a larger area
When zoomed in, results become more localized and dense
This means you are not seeing every possible location at once.
To find more locations:
Zoom in to a smaller area
Pan the map to a new location
After moving or zooming, a “Search this area” button will appear. Click it to refresh results using your current search term.
In addition, if you have selected a specific shape or polygon in your left-hand drawer, the search function will execute only within the bounds of that polygon.
Understanding Search Results
After running a search:
Results appear in the right-hand panel beneath the search bar
Matching markers are displayed on the map
Each result includes options for saving and categorization
Important: Search results are temporary and are not saved automatically.
To retain results, you must:
Classify each POI as General, Competitor, or Ally
Save them to a folder
If you navigate away from the search panel, clear the results, or run a new search before saving, all current results will be removed.
→ Important note on saving POIs.
How to Categorize POIs
Each POI can be assigned to one of three categories:
General — neutral locations
Competitor — businesses competing for the same demand
Ally — complementary businesses that may drive shared traffic
To categorize a POI:
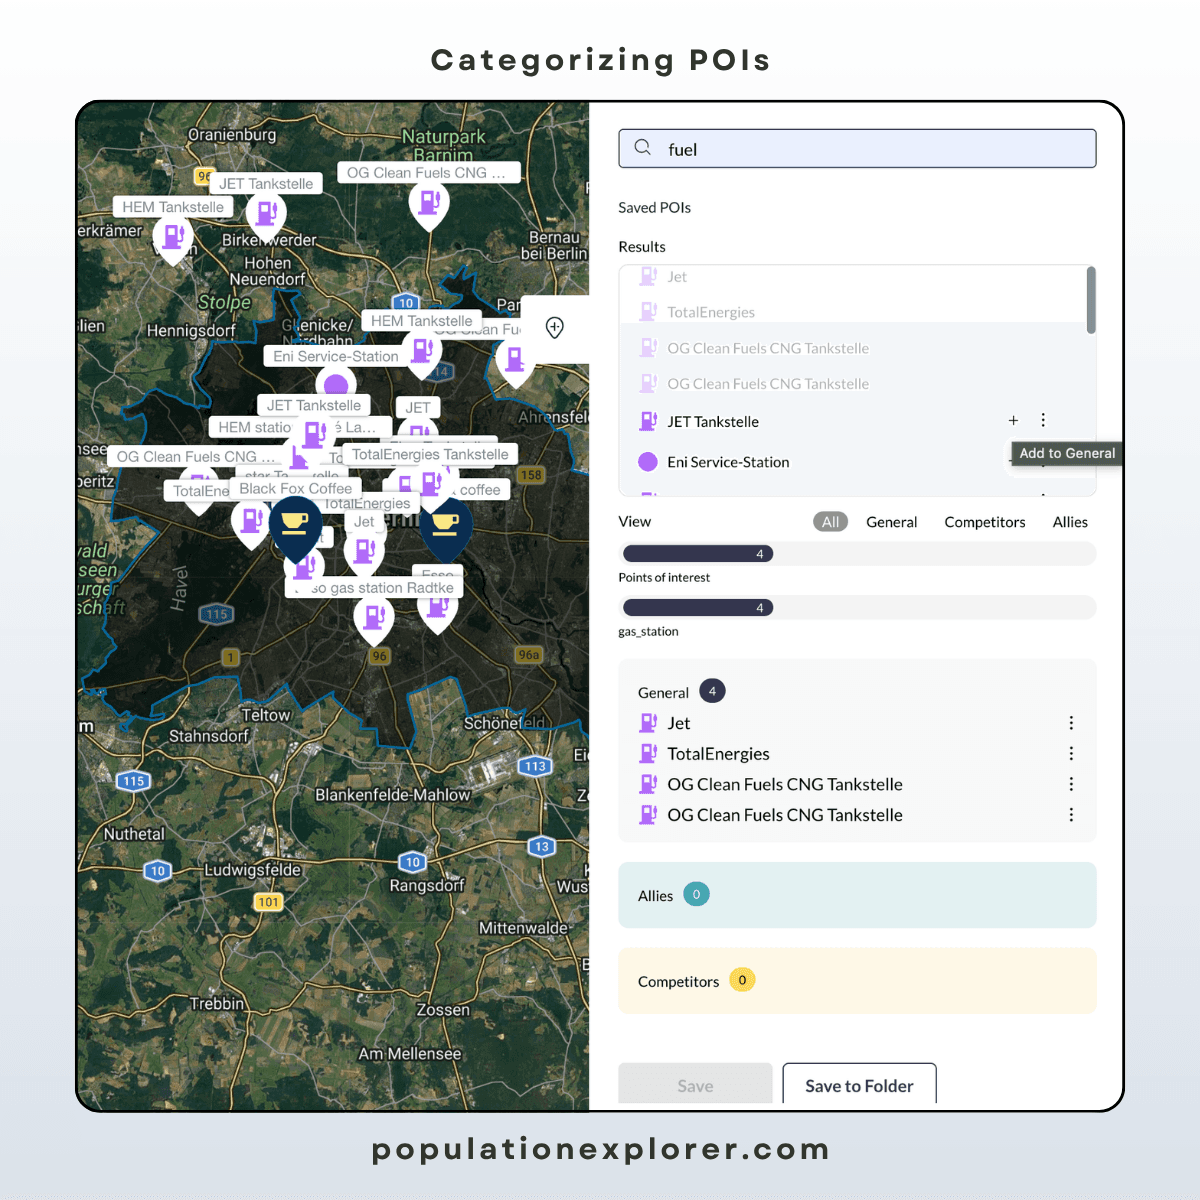
Click the “+” icon to add it as a General POI
Click the three-dot menu to assign it as a Competitor or Ally
How to Save POIs to a Folder
Select POIs using the + icon or three-dot menu
Click Save
Choose one of the following:
Save
Save to folder
Reset (clears unsaved search results)
Clicking Save will save the categorized POIs to the currently selected folder. To save POIs to a different folder, click ‘Save to folder’ and use the dialogue box to either select a different folder or create a new one.
Clicking ‘Reset’ will clear all POI search results.
Saved POIs will appear in the left-hand folder panel, where they can be used for further analysis.
Searching Within a Selected Area
If you select a polygon before running a POI search, results will be limited to that specific boundary.
This is one of the most commonly used POI workflows. Franchisors and site selectors often use it to evaluate competitor density and ally density within defined trade areas, comparing territories to identify the most promising opportunities.
To run a boundary-based POI search:
Create or load your territory boundaries into a folder. This can include:
ZIP codes or other administrative boundaries
Manually drawn polygons
Select the boundary you want to analyze
Run your POI search
Save the results
Once saved, the POIs will be associated with that specific territory, allowing you to compare locations based on competitor and ally presence.
What to Do Next
Once you’ve saved General, Competitor, and Ally POIs, you have the foundation for more advanced territory and site analysis.
Two of the most common next steps are:
Identifying whitespace opportunities
Evaluating competitor and ally density
These analyses form the basis for forecasting territory performance and identifying expansion opportunities.
Whitespace Analysis
Whitespace analysis helps you identify areas where demand exists but coverage is limited.
This typically involves:
Assigning territory boundaries to competitor locations
Visualizing where those territories overlap—and where they don’t
Identifying corridors with population that are not effectively reached
In Population Explorer, you can do this by running the bulk territory tool (isochrones or radius buffers) across all saved competitor POIs.
Read more about whitespace analytics here, or read our whitespace analysis of Jakarta.
Competitor and Ally Density Analysis
This analysis helps you understand how competitive (or supportive) each territory is.
A common approach is to calculate:
Population per competitor (competitor density)
Population per ally (ally density)
You can base these metrics on:
Residential population
Daytime (ambient) population
Comparing these across territories allows you to see where competitive pressure is highest, and where conditions are more favorable for expansion.
Common Questions
Q: Why am I only seeing 20 results?
A: Each search returns up to 20 locations based on your current map view. Zoom in or move the map to find more.
Q: How do I find additional locations?
A: Zoom in or pan the map, then click “Search this area” to refresh results.
Q: What’s the difference between competitors and allies?
A: Competitors serve the same demand. Allies are complementary businesses that may increase traffic or demand in the area.
Q: Why did my results change after zooming?
A: Results are dynamically based on your map view, so zooming or moving changes which locations are returned.
Explore our latest thinking on franchise territory design, retail site selection, and the population data that powers smarter location decisions.

Aug 7, 2026
Daytime Differential: What It Is, and Why Your Retail Site Selection Strategy Needs It
What is Daytime Differential? The ratio of ambient to residential population for a site, and why site selection needs both types of data to make informed decisions.

Aug 7, 2026
Daytime Population of Europe's Million-Plus Cities, Ranked (2026)
Daytime vs. residential population, ranked across Europe's 43 million-plus cities. Some nearly double during the day; others barely hold half.

Jul 27, 2026
UK Postcode Districts Ranked by Ambient Population: Growth Leaders and Decliners (2016–2024)
This report ranks UK postcode districts by ambient population using LandScan data covering 2016 to 2024. Ambient population measures where people actually concentrate throughout the day, across employment, commuting, retail, logistics, and commercial activity, rather than simply where they sleep at night.